In economics, we believe that the equilibrium of supply and demand in the market maximizes the total benefits received by sellers and buyers. Similarly, the price that balances the supply and demand for the product is the best one as it maximizes the total welfare of consumers and sellers or producers. So, economists consider a perfectively competitive market as an efficient market. Here we discuss the meaning of market efficiency, consumer’s surplus, and producer’s surplus, and measurement of efficiency through consumer and producer surplus.
Contents
Meaning of Market Efficiency
Market efficiency is related to the welfare of the consumers as well as producers. Economists use consumer surplus and producer surplus as the basic tools to measure the welfare of the buyers and sellers in a market. These tools are helpful to answer the issue like whether or not scarce resources are efficiently allocated or not.
Efficiency refers to the property of resource allocation in such a way that maximizes the total surplus received by all the members of the society. It means if an allocation of resources maximizes total surplus then such allocation is called efficient allocation or simply efficiency. If it is not efficient, then it means some of the potential gains from such allocation have not been realized by the sellers and buyers. Thus, a market is said to be efficient when the resources are allocated in such a way that maximizes the total surplus or gains or benefits of all the members or participants of the society. In the situation of efficiency, every resource is optimally allocated by minimizing waste. There are two types of efficiency as productive efficiency and allocative efficiency.
Productive efficiency
Productive efficiency is the situation where output is produced at minimum cost. Thus it is concerned with producing goods and services with the optimal combination of input so that maximum production is possible to produce at minimum cost. To achieve productive efficiency a firm must use its productive scarce resources in such a way that ensures the possibility of production of output at the lowest possible per-unit cost. Therefore, productive efficiency is achieved at the lowest point on a firm’s average cost curve.
Allocative Efficiency
It is the situation where the price is equal to marginal cost. This occurs when there is an optimum distribution of produced goods and services considering the preferences of consumers. It indicates a certain level of output where price equals the marginal cost of the production. This ensures that the price consumers are willing to pay is equal to the marginal utility that they get. So the finest or optimal allocation is obtained if the marginal utility/price of the good equals the marginal cost.
Thus the economic outcome is one for which it is not possible to make someone better off without hurting someone else. When an economy is economically efficient, any changes made to give benefit one producer or consumer would harm another. In its opposition, the situation will be inefficient if the change in consumption or production makes someone better off without hurting someone else. Thus, three conditions must hold if the economic outcome is to be efficient for a particular good.
- The marginal benefits must equal to marginal cost
- Maximum consumer’s surplus and the marginal benefit of consuming the good should be equal for all consumers
- The maximum producer’s surplus and the marginal cost of producing the good should be equal for every producer.
Consumer’s Surplus
The French Engineer Jules Dupuit in 1844 introduced the concept of consumer surplus theory to measure the social benefits of public projects like bridges, highways, etc. Later on, this concept was developed by Alfred Marshall in his popular book ‘Principle of Economics’ published in 1890. The concept of consumer surplus is based on the law of diminishing marginal utility.
Consumer surplus is the gap between willingness to pay and the actual price of the product. Willingness to pay is the maximum amount that a buyer will pay for a good. The willingness to pay for a consumer is based on the need or worth or utility of any product. Thus consumer surplus is the benefit that the consumer receives over what he is willing to pay for a product (marginal benefit) and what he pays (the price of the product). Consumer surplus thus measures the benefit buyers receive from participating in a market. It can be calculated by using the given formula;
Consumer Surplus (C.S) = Value of Buyers or Willingness to Pay- Amount Paid by Buyers or Actual Price Paid by Consumer
For example, if a consumer wants to buy a car and he is ready to pay Rs. 40, 00,000 for that car. But the actual price of the car in the market is Rs. 35, 00,000. Here, the consumer’s surplus is Rs. (40, 00,000 – 35, 00,000) = Rs. 500,000.
In the case of multi-unit consumption, the consumer surplus is the difference between willingness to pay and the actual market price for every unit of consumption. The price consumers pay is always equal to marginal utility or expected marginal benefit. The marginal utility or marginal benefit beyond the market price in every unit of consumption is the consumer’s surplus. The following table will help us to get the concept of consumer surplus in case of a multi-unit consumption decision.
| Units | Willingness to Pay or Expected Price | Actual Price Paid or Market Price | Consumer’s Surplus |
| 0 | 10 | 5 | 5 |
| 1 | 9 | 5 | 4 |
| 2 | 8 | 5 | 3 |
| 3 | 7 | 5 | 2 |
| 4 | 6 | 5 | 1 |
| 5 | 5 | 5 | 0 |
| Total | 45 | 30 | 15 |
When a consumer expects the price of the commodity Rs. 10, he is not willing to purchase. This consumer is ready to pay Rs.9 for the first unit of the commodity. He wants to pay Rs. 8, Rs.7, Rs.6, and Rs. 5 for second, third, fourth, and for the fifth unit of commodity respectively. When the market price of the commodity is Rs. 5, the consumer is ready to consume 5 units of the commodity. At the fifth unit of consumption, his marginal benefit equals the market price of the commodity. In such a situation his surplus is zero. From the table, we can see that the total willingness to pay is Rs. 45, and the total market price for 5 units of consumption is Rs. 30. So the total consumer surplus is Rs. 15
For the measurement of consumer surplus, we use the demand curve. The following figure helps us to understand the measurement of consumer’s surplus.
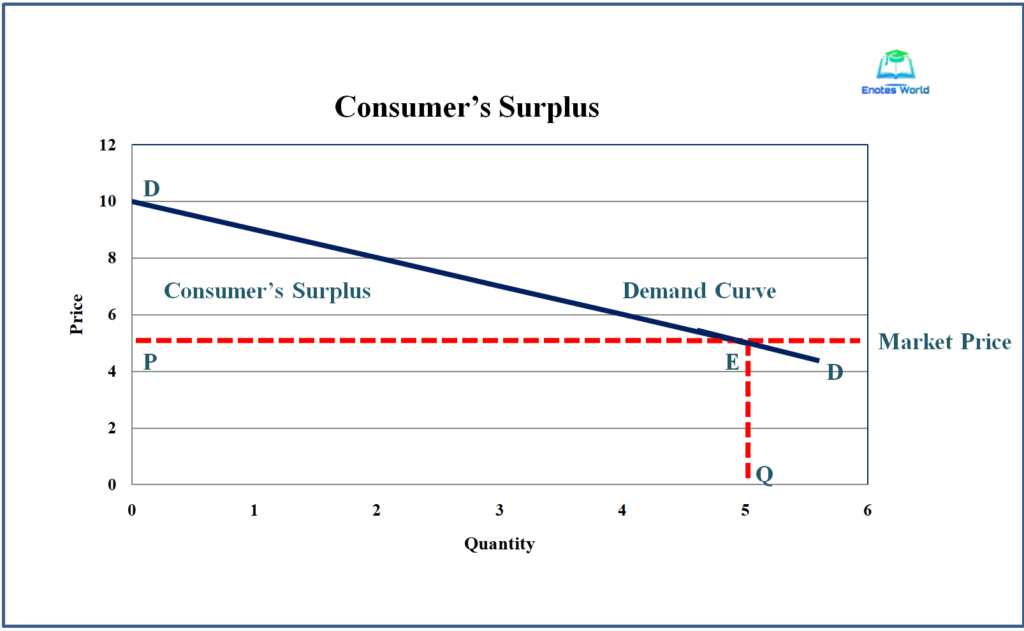
In the figure, DD is the downward sloping demand curve that shows the willingness to pay of the consumer. This is also known as the marginal utility curve for consumers that reflects the law of diminishing marginal utility. The market piece of the commodity is Rs. 5 nut the consumer wants to pay different prices for different 5 units of the commodity. At the fifth unit of the commodity, the consumer wants to pay Rs. 5 and thus he gets no consumer surplus. Thus the total area beyond the market price line (PED) is the consumer’s surplus.
In the diagram,
Willingness to Pay= Area of ODEQ
Actual Market Price= Area of OPEQ
Thus, Consumer Surplus (C.S) = Area (ODEQ-OPEQ) = Area PED
In the figure triangle, PED is the consumer’s surplus and the area of triangle PED can be measured by using the following formula.
Areal of triangle PED= ½ * base* height =1/2*PE*PD
Example of Measurement of Consumer’s Surplus
Suppose the given market demand function is Q=500-20P. If the price of the product in the market is Rs. 5, then calculate the consumer’s surplus.
Here we can measure the consumer surplus from the given infiltration as;
Given demand function is Q=500-20P and the market price is Rs. 5
When P=5, then Q= 500-20*5= 400 Units
To calculate the consumer’s surplus, we have to calculate the highest price of the product. At the highest price consumers, demand will be zero. Therefore, calculating maximum price requires,
0=500-20P
Or, 20P=500
Or, P=25
Thus, the maximum price is Rs. 25. The information obtained here can be shown in the following diagram.
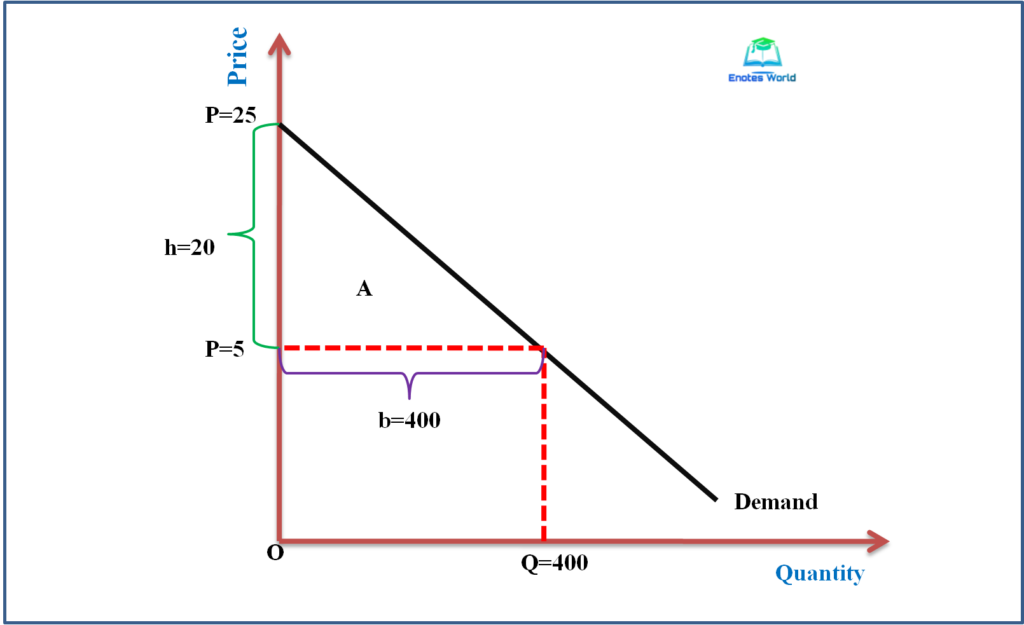
From the diagram we can calculate the consumer’s surplus as;
C.S= Area of triangle A= ½*b*h= ½*400*20= 400
Thus the value of consumer surplus is 400 when the market price is Rs.5 and the demand function is Q=500-20P.
The value of consumer surplus is never negative. Whenever the market price of the commodity is higher than the willingness to pay of the consumer or the expected benefit of the consumer, he will leave the market without purchasing the product. If the market is below the expected marginal benefit/willingness to pay then more consumers will participate in the market. Thus consumer surplus will increase if the market price is lower than a willingness to pay and vice versa. The higher the gap between willingness to pay and the actual market price of the product higher will be the value of consumer surplus and accordingly higher will be the participation of consumers in the market.
Producer’s Surplus
This concept (producer’s surplus) measures the benefit that sellers receive from participating in the market. Producer surplus is the benefit that producers receive over his cost of providing goods against what he is paid for that good. It means the producer’s surplus is the amount a seller is paid minus the cost of production. In other words, it is the difference between the actual price received by sellers and the cost of producing a product. Thus, this is the benefit enjoyed by producing firms from their perspective. The formula used to measure producer’s surplus is given as;
Producer’s Surplus (P.S) = Amount Received by Seller or Actual Price Paid to Seller- Minimum Supply Price or Cost of Seller
For example, if a seller wants to sell a car at Rs. 35, 00,000 but the actual price of the car in the market is Rs. 45, 00,000. Here, the producer’s surplus is Rs. (45, 00,000-35, 00,000) = Rs. 10, 00,000.
In the case of multi-unit sales, the producer’s surplus is the difference between the actual market price and the price at which the producer is ready to sell (minimum supply price or marginal cost) for each of the units of sale. The supply curve reflects the minimum supply price or marginal cost of every unit of production. The following table helps to get the concept of the producer’s surplus more clearly.
| Units | Minimum Supply Price or Marginal Cost or Cost of Production | Actual Price Received or Market Price of the Product | Producer’s Surplus |
| 0 | 1 | 6 | 5 |
| 1 | 2 | 6 | 4 |
| 2 | 3 | 6 | 3 |
| 3 | 4 | 6 | 2 |
| 4 | 5 | 6 | 1 |
| 5 | 6 | 6 | 0 |
| Total | 21 | 36 | 15 |
In the above table, at the expected price of Rs.1, the producer is not willing to supply his product into the market. He is only ready to sell when he gets Rs. 2 per unit for his output. Thus, he wants to sell the second, third, fourth, and fifth units of output at the price of Rs. 3, Rs.4, Rs.5, and Rs.6 respectively. When the market price is Rs. 6 then the producer gets Rs. 36 from the market by supplying 5 units but he is ready to supply such 5 units at Rs. 21. So his surplus from the selling of 5 units is Rs. (36-21) = Rs. 15
We use the supply curve to measure the value of the producer’s surplus. The following figure will help us to measure the value of the producer’s surplus.
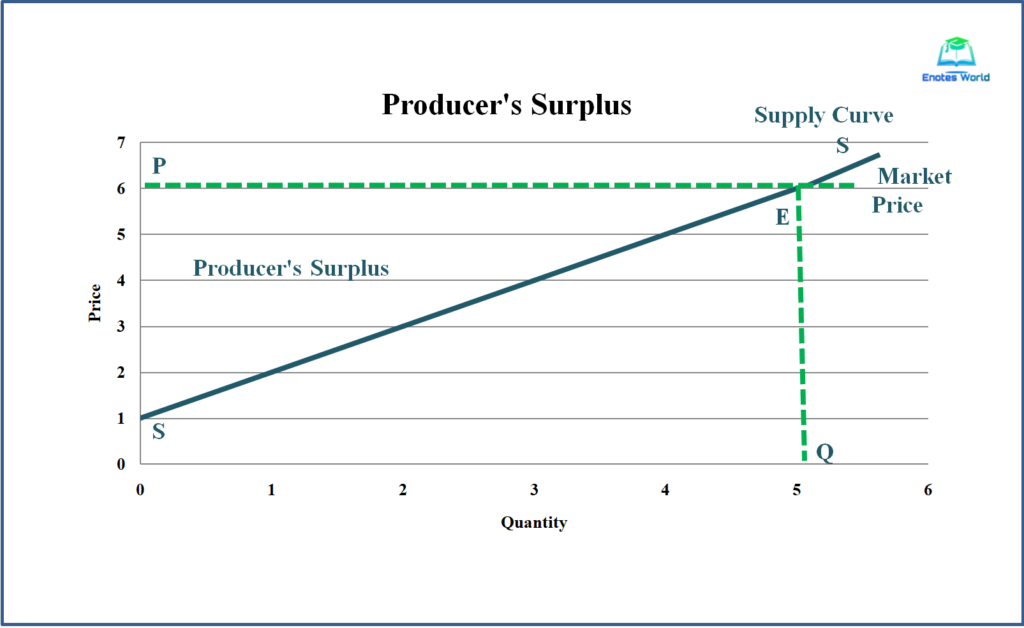
In the above figure, SS is an upward sloping supply curve of the seller. The supply curves also the marginal cost curve that shows the seller’s willingness to sell. Rs. 6 is the current market price that existed in the market. However, the sellers want to sell his 5 units of output at different prices. So the total area between the market price line and the supply curve is the producer’s surplus. This is the area of triangle PES.
In the diagram,
Willingness to Sell or Minimum Supply Price = Area of OQES
Actual Market Price= Area of OPEQ
Thus, Producer’s Surplus (P.S) = Area (OPEQ-OPES) = Area PES
In the figure triangle, PES is the producers’ surplus and the area of triangle PES can be measured by using the following formula.
Areal of triangle PES= ½ * base* height =1/2*PE*PS
Example of Measurement of Producers’ Surplus
Suppose the given market supply function is Q=-100+10P. If the price of the product in the market is Rs. 20, then calculate the producer’s surplus.
Here we can measure the producer surplus from the given infiltration as;
Given the supply function is Q=-100+10P and the market price is Rs. 20
When P=20, then Q= -100+10*20= 100 Units
To calculate the producer’s surplus, we have to calculate the lowest price of the product. At the lowest price, the seller’s supply will be zero. Therefore, calculating minimum price requires,
0=-100+10P
Or, 10P=100
Or, P=10
Thus, the minimum price or minimum supply price is Rs. 10. The information obtained here can be shown in the following diagram.
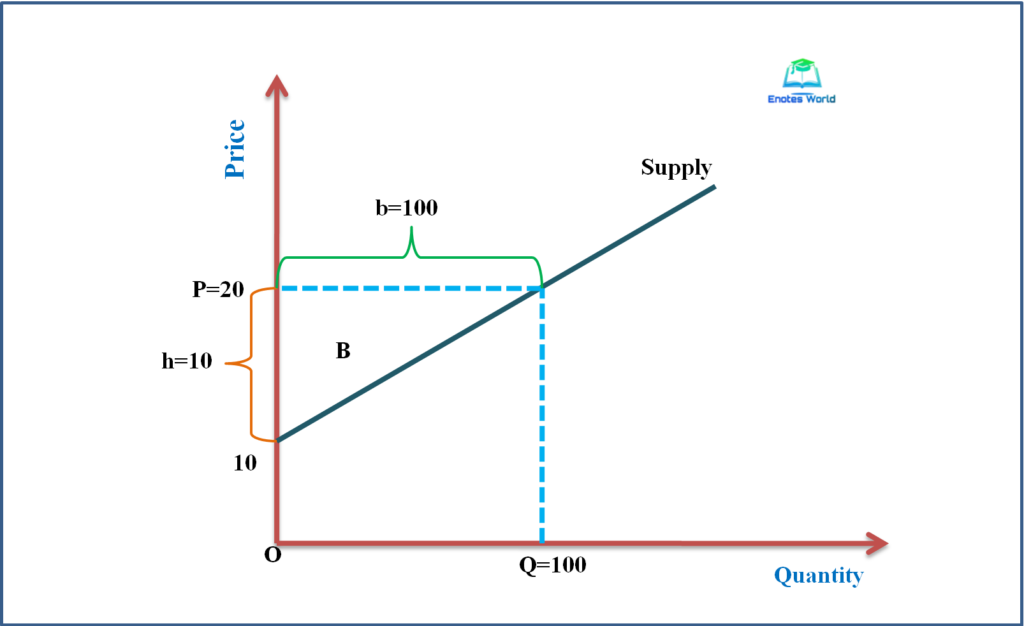
From the diagram we can calculate the producers’ surplus as;
P.S= Area of triangle B= ½*b*h= ½*100*10= 500
Thus the value of producer surplus is 500 when the market price is Rs.20 and the supply function is Q=-100+10P.
The value of producers surplus is also never negative. It is because the producer does not sell at the price lower than its minimum supply price or marginal cost of the production. If the market price is higher than the minimum supply price then the seller will encourage selling more and more sellers will participate in the market. If the price is lower then there will be low participation of sellers such that the producer’s surplus decreases. So the producer’s surplus increases with an increase in market price and vice versa.
Measurement of Market Efficiency by Consumer’s and Producer’s Surplus
For the policymakers or planners, total surplus (summation of consumer surplus and producer surplus) is one of the ways to measure the efficient allocation or economic well-being of the society. Consumer surplus is the benefit that buyers receive from participating in the market and producer surplus is the benefit that producers receive. It is thus natural to use total surplus as a measure of society’s economic well-being. The larger amount of these two shows the better off people in the society.
Here,
Consumer surplus= Value to buyers-Amount paid by buyers
Producer surplus= Amount received by sellers-Cost to sellers
When we sum consumer and producer surplus together, we obtain a total surplus. Thus,
Total surplus= (Value to buyers-Amount paid by buyers) + (Amount received by sellers-Cost to sellers)
The amount paid by the buyers is always equal to the amount received by the sellers. Thus the middle two terms in the above expression cancel each other. And we catch the subsequent final term as;
Total Surplus = Value to buyers-Cost to sellers
Therefore, the total surplus in a market is the difference between the value to the consumers or buyers and the cost to the sellers or the minimum supply price or the cost of production to the sellers. If the positive value of the total surplus is increased then we can say that the allocation is efficient. If an allocation is not efficient, then some of the potential gains from transactions or trade among buyers and sellers may not be realized.
The competitive market maximizes the value of the total surplus. The following figure shows the evaluation of market efficiency with the help of consumer surplus and producer surplus.
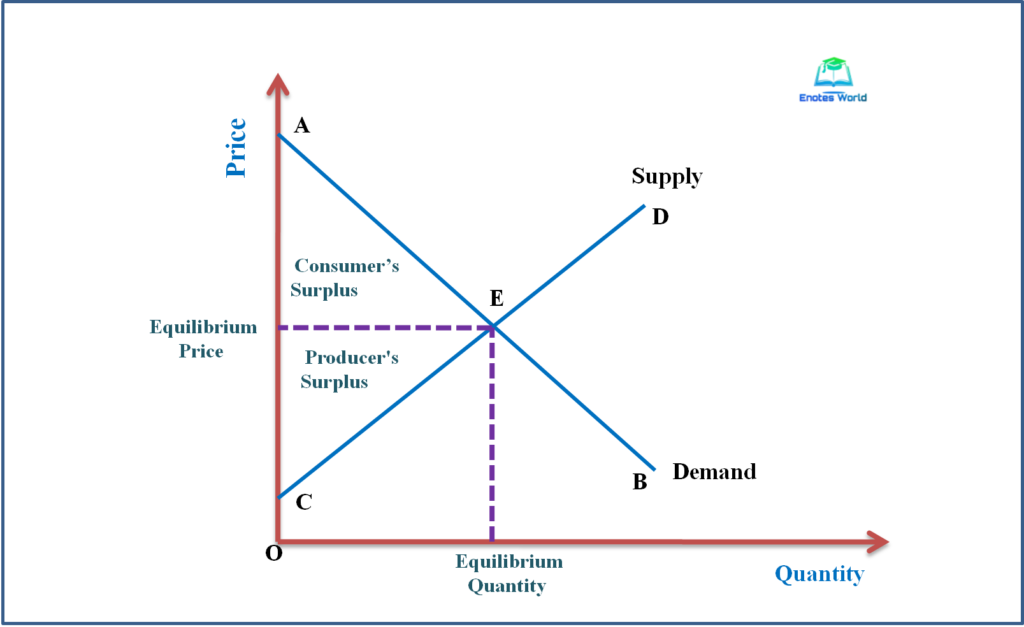
The above figure shows consumer surplus and producer surplus when a market reaches equilibrium by interacting demand and supply. The entirety part involving the supply and demand curves to the interaction point of demand-supply (equilibrium point) depicts the total surplus in the market.
From the figure we can say that;
- Those buyers who value the good (willing to pay for the good) more than the equilibrium price as represented by AE on the demand curve choose to buy the good,
- The buyers who value it less than the price as represented by EB on the demand curve do not buy,
- Those suppliers whose costs are less than the price as represented by segment CE of the supply curve choose to produce and sell in the market, and
- The sellers whose costs are greater than the price as represented by the segment ED on the supply curve do not produce and sell.
Such observations lead to three distinct insights about the outcomes of the market;
- Free markets distribute or allocate products to those consumers or buyers who value them most highly as measured by their willingness to pay,
- Such a free-market mechanism allocates the demand for goods to the sellers who can produce them at the least cost.
Therefore, given the produced quantity and sold quantity in market equilibrium, the social planner cannot increase economic efficiency by altering the distribution of consumption among buyers or the distribution of production among sellers. Similarly, the planner cannot raise the quality of goods and services by adopting the intervention in the free market mechanism. Thus the third insight states that;
- The free market produces the quality of goods that maximizes the sum of consumer and producer surplus.
So the perfectly competitive market can maximize the total benefits and ensure the efficient allocation of scarce resources. The following figure helps to prove such a mechanism more strongly.
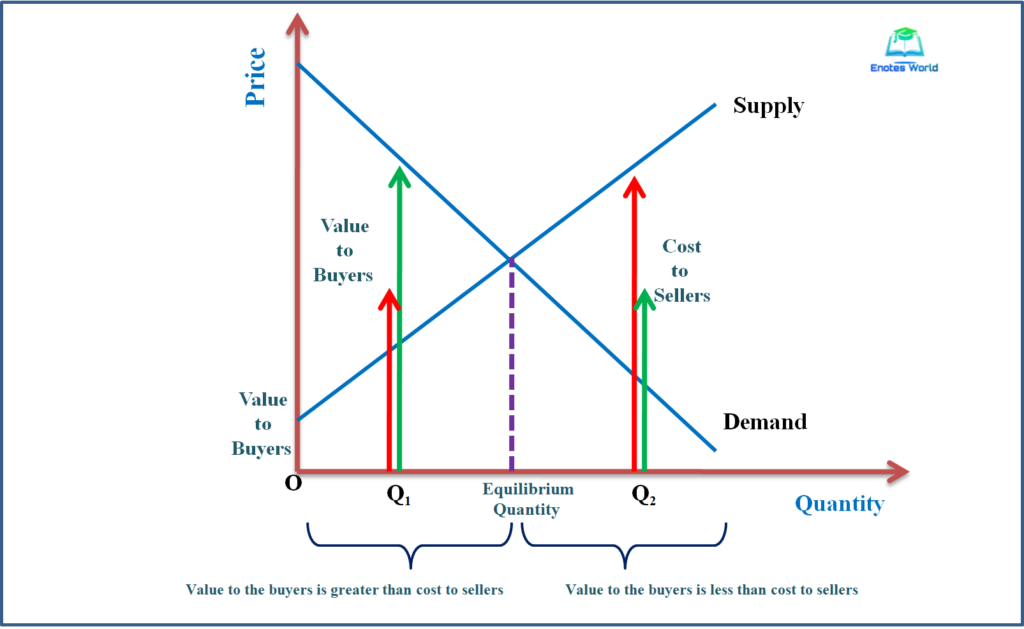
In the figure, at quantity Q1, the value to the consumers or marginal buyers is greater than the cost to the marginal producers. As a result, increasing the production quantity and increasing consumption rises the total surplus. This will go continue until the quantity reaches the equilibrium level. Similarly, at the Q2 level of output, the value to the marginal consumer is less than the cost to the marginal sellers. In such a situation, decreasing the quantity will increase the total surplus and thus the decreasing process will go continue until it will reach equilibrium. Thus to maximize the total surplus the planner has to choose the equilibrium position where the demand and supply curve interacts with each other.
Therefore, if the demand and supply intersect with each other freely, the total surplus will become maximum, and thereby the maximum number of consumers and producers will participate in the market and get the maximum benefit from their perspectives. With the maximization of total surplus, market efficiency is also said to be achieved.
References and Suggested Readings
Adhikari, G.M. and et.al. (2019). Microeconomics for Business. Kathmandu: KEC Publication
Dhakal, R. (2019). Microeconomics for Business. Kathmandu: Samjhana Publication Pvt. Ltd.
Mankiw, N.G. (2009). Principles of Microeconomics. New Delhi: Centage Learning India Private Limited
Salvatore, Dominick. (2003). Microeconomics: Theory and Application. Oxford University Press, Inc.
Shrestha, P.P. and et.al. (2019). Microeconomics for Business. Kathmandu: Advance Sarswati Prakashan.