Contents
Meaning of Iso-quant
In the long-run producer can change all the factors and thus output can also be changed by all the factors of production. The level of output that can be produced by different combinations of factors (especially labor and capital) is shown by the iso-quant curve. Isoquant refers to the same quantity. An iso-quant curve represents various combinations of two inputs (i.e., labor and capital) that gives the same level of output (measured cardinally). It means that the isoquant is the curve that shows different combinations of any two inputs, but all those combinations give the same level of output. In this article, we try to explain the meaning and derivation of the iso-quant curve.
The term iso-quant has been derived from the Greek word ‘iso’ which means equal and the Latin word ‘quant’ which means quantity. Thus, the isoquant curve is also known as the equal product or equal quantity or the production indifference curve.
Assumptions of Meaning and Derivation of the Iso-quant Curve
The foundation of the iso-quant curve is based on the following assumptions.
- There are only two inputs labor and capital to produce a particular commodity.
- Labour and capital can be substituted for one another at a diminishing rate.
- Two inputs (labor and capital) are perfectly divisible in any small quantity. It means that the production function is continuous in nature.
Based on the above assumptions, the concept of iso-quant can be explained with help of the following iso-quant schedule.
Iso-quant Schedule
The iso-quant schedule can be defined as the tabular presentation of different combinations of labor and capital that show an equal level of output.
| Combination | Labour | Capital | Output |
| A | 1 | 12 | 80 |
| B | 2 | 8 | 80 |
| C | 3 | 5 | 80 |
| D | 4 | 3 | 80 |
| E | 5 | 2 | 80 |
The above table shows the isoquant schedule. It is the tabular presentation of different combinations of labor and capital that show equal levels of output. For example, combination A shows one unit of labor and 12 units of capital. Combination B shows 2 units of labor and 8 units of capital. Similarly, combination E shows 2 units of labor and 2 units of capital. All those combinations A, B, C, D, and E show the same level of output (800 units). The above isoquant schedule can be shown in the following diagram.
Isoquant (IQ) Curve
It is the graphical representation of the isoquant schedule. Thus, the isoquant curve is the locus of different combinations of two inputs labor and capital that ensure the same level of output. It is shown in the following diagram.
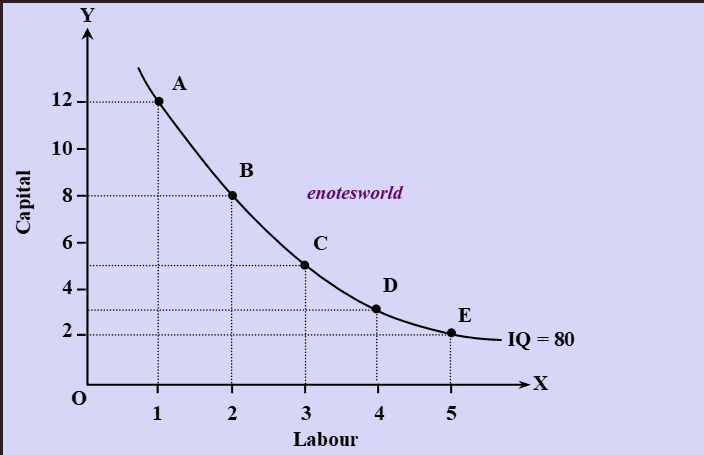
In the figure, IQ is an iso-quant curve that shows equal quantity, 80 units of a commodity throughout its length. In the curve, points A, B, C, D, and E show different combinations of labor and capital but they produce the same level of output i.e., 80 units. This is because the gain in output from using more units of labor must equal the loss in output from decreasing units of capital and vice-versa. It is downward sloping because if labor employment is increased then the employment of capital is needed to decrease to keep the same levels of output at every combination of labor and capital.
very informative indeed.