Economic growth can be defined as the increase in the real national product or output over time. Economic growth during any given period is determined or expressed as dY/Y. Therefore, economic growth must mean that an ever-increasing quantity of goods and services is available to meet the needs of the economy over time. To be meaningful, economic growth should cause an improvement in the economic welfare of the people of the country and should be accompanied by the distribution of national income in favor of the poor. This is possible only if the rate of growth of output exceeds the rate of growth of the population in the economy.
Some economists consider per capita real income as a good measure of economic growth. According to per capita real income measure, per capita real consumption is derived that indicates the growth in consumer’s economic welfare over time. Another concept relating to the measurement of economic growth is the real GNP per unit of labor input or combined labor-capital unit. This concept stresses changes in the economy’s productivity over time.
Economic growth over time may be due to different factors. It may be due to an improvement in the qualitative performance (productivity) of the given inputs or due to quantitative increase in economy’s factor endowments or it may be due to a combination of both these factors. For instance. While the economy’s total labor force increases over time, its productivity may also increase. The performance of the economy’s capital stock may improve while it grows over time. Regardless of the factors responsible for growth, it will be reflected in an upward shift of the production possibilities curves or the production frontier of the economy assuming that all resources are optimally employed. The following figure shows the five production possibilities curves representing 1960, 1970, 1980, 1990, and 2000 for an economy (Vaish, 2014).
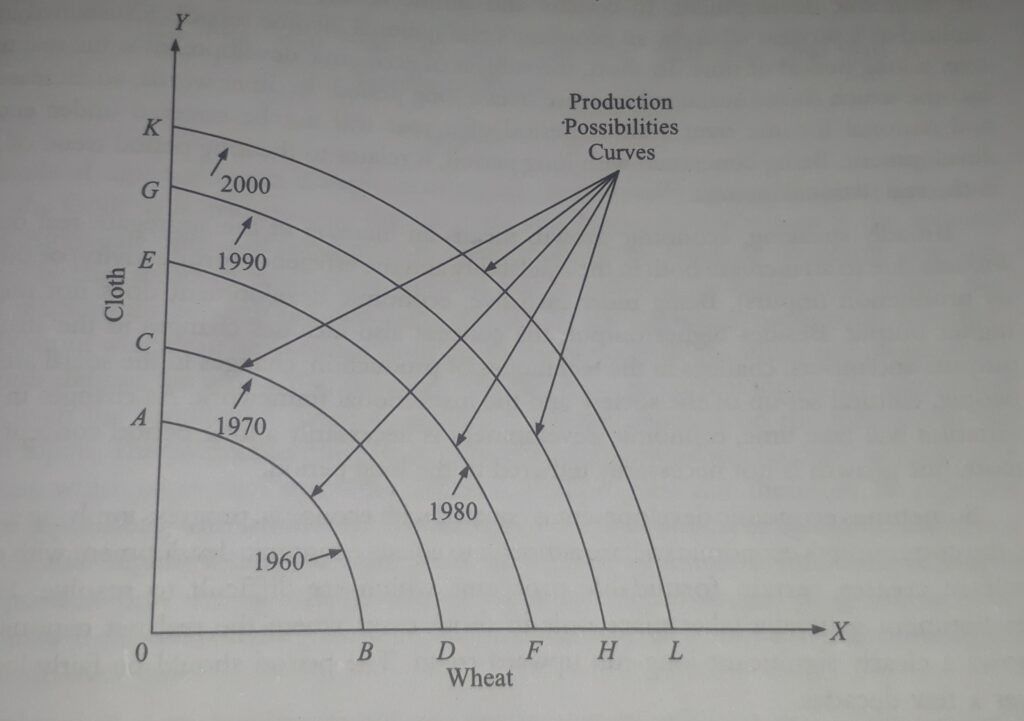
Each of these five PPC shows the various alternative optimal combinations of cloth and wheat that can be produced with the economy’s total resources when these are fully employed. In 1960, the PPC is represented by AB that is lower than all others. Over time, the economy’s productive capacity has been expanding and after a decade in 1970, it is represented by the higher PPC CD. Accordingly, curve KL represents the highest PPC for 2000.
Here, an upward shift in PPC indicates or measures the growth of the economy in quantitative terms, it cannot, however, be said conclusively whether or not the upward shifts in the PPC has been due to either an improvement in the productivity of the economy’s resources or due to the increase in the economy’s total resources endowments or due to both of these factors. Looking at the literature and past experiences, generally, PPC shifts upward due to the operation of both.
Reference
Vaish, M.C. (2014). Macroeconomic Theory. Vikas Publishing House Pvt Ltd