One of the fundamental concepts of economics, the law of demand states that there is an inverse relationship between the price and demand for a product underneath the assumption of ceteris paribus. However it is not the only price that affects the demand but also there are many other factors such as the income of the consumers, taste, and preference, price of related goods, advertisement expenditure, demonstration effect, distribution of income, price of related goods, expected future price, social rituals, and customs, etc. that have direct and indirect effects on consumer’s demand. If there is any change in any factors mentioned above then there is a corresponding change in quantity demand as well. Such a change in demand for the product due to a change in its determinants can explain an analysis of the Movement and Shift in the Demand Curve as;
- Movement along Demand Curve/Change in Quantity Demand
- The shift in Demand Curve/Change in Demand
Contents
Movement along the Demand Curve or Change in Quantity Demand
Change in quantity demand or movement along the demand curve refers to the situation where there is a change in the amount of demand of a commodity (increase or decrease) due to a change in its price while other factors affecting demand/determinants of demand (like income, taste and preference, price of related goods, advertisement, expected future price, etc.) remain constant. Therefore, movement along the demand curve or change in quantity demand explains the change in demand for goods and services due to the change in the price alone. Changes in the quantity demand may be of two types;
- Expansion of Demand
- Contraction of Demand
Expansion of Demand
When the quantity demand of a commodity rises due to a fall in its price, other things remain the same, then it is the rise in quantity demand or expansion of demand.
Contraction of Demand
Contraction of demand or fall in the quantity demanded refers to a decrease in the quantity demanded of a commodity as a result of a rise in its price, other things remaining the same.
The following table helps us to understand the concept of movement along the demand curve in a better way.
| Price (in Rs.) | Demand (in kg) |
| 10 | 400 |
| 15(Rise) | 200 (Contraction in Demand) |
| 5 (Fall) | 600 (Expansion in Demand) |
In the above table when the price of goods falls from Rs. 10 to Rs. 5, a consumer’s purchase rises from 400 units to 600 units. This is the expansion of demand. Similarly, if a price increases from Rs. 10 to Rs. 15, the consumer’s purchase falls from 400 units to 200 units. This is the contraction of demand.
Any point on a demand curve represents a particular quantity that is to purchase at a specified price. Different points on a demand curve represent different quantities demanded at different prices. Therefore, a change in quantity demanded is represented by a movement along a particular demand curve. A movement down a demand curve is called a rise in the quantity demanded or expansion of demand. On the other hand, a movement up the demand curve is known as a fall in quantity demanded or a contraction of demand.
Thus, a change in the quantity demanded as a result of a change in the price of a commodity alone is not able to draw a new demand curve, but it is represented by the movement up or down on a given demand curve. This concept can be further understood with the help of the subsequent diagram;
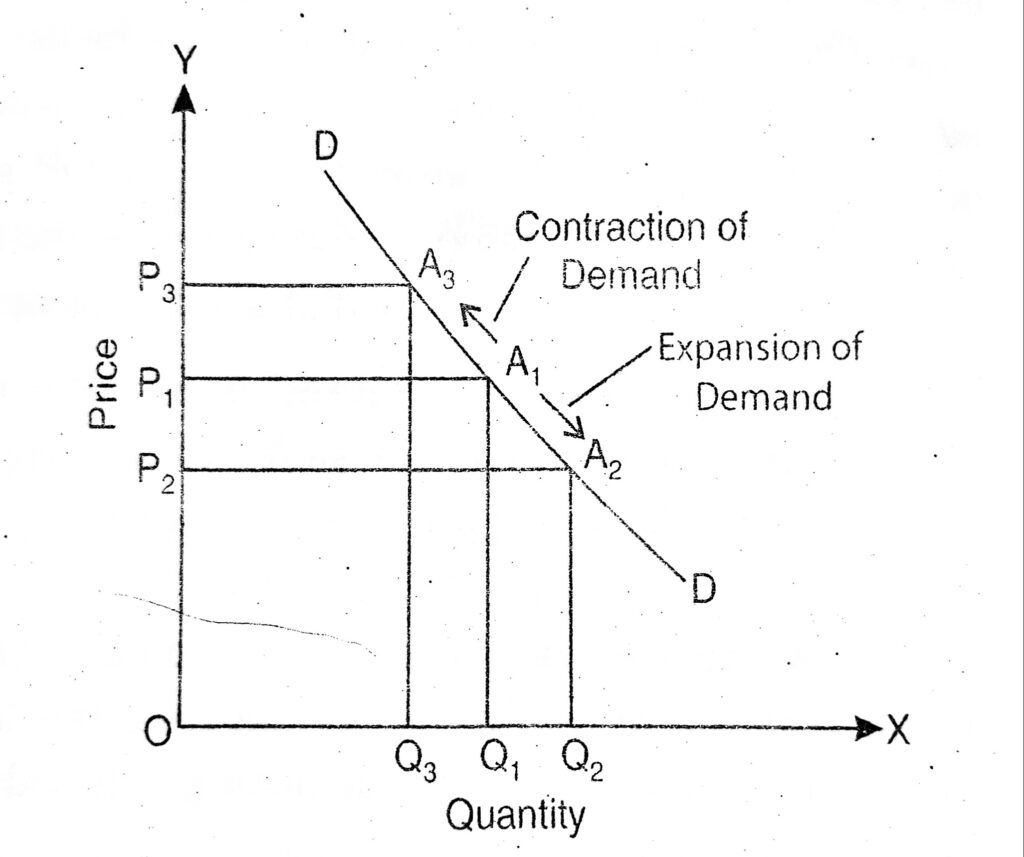
In the above diagram, at price OP1, the quantity demand is OQ1. Now, if the price of the commodity falls to OP2, the quantity demanded rises to OQ2. This movement from A1 to A2 in a downward direction on the given demand curve DD is the expansion of demand. On the other hand, if the price of the commodity rises from OP1 to OP3, the effect is a decrease in quantity demand from OQ1 to OQ3. This is a movement upward from A1 to A3 and is known as the contraction of demand.
Therefore, the expansion of demand is due to a fall in price, other things remain the same. The downward movement along the demand curve represents the expansion of demand.
Similarly, contraction of demand results from a rise in the price, other things remaining the same. It is signified by an upward movement along the demand curve.
The Shift or Change in Demand
The purchase decision of the consumer may change not only by a change in the price of the commodity but also due to changes in other factors such as income, taste and preference, price of related goods, size and composition of the population, and so on. If the quantity demand of a commodity rises or falls due to a change in factors or determinants of demand other than price is known as a shift in the demand curve or change in demand. Therefore shift in the demand curve is related to a change in demand due to a change in determinants of demand other than the price of the commodity.
A change in demand is involved when the entire demand curve shifts. An increase or decrease in demand due to a change in determinates except the price is represented by shit in the demand curve. It may be of two types;
- Increase in Demand or Rightward/Outward Shift
- The decrease in Demand or Leftward/Inward Shift
Increase in Demand
It refers to a case in which the consumers prefer to buy a larger quantity of a commodity at the same price due to favorable changes in factors other than the own price of the commodity. An increase in demand may take place due to an increase in income, favorable change of taste and preferences, rise in the price of substitute commodities, fall in the price of complementary goods, increase in the size of the population, redistribution of income, and so on. It is a rightward or outward shift in the demand curve.
Decrease in Demand
It refers to a situation in which the consumers buy less quantity of the commodity at the same price. The decrease in demand takes place due to the unfavorable change in factors affecting demand other than the own price of the commodity. It is a leftward or inward shift in the demand curve.
The concept of rightward and leftward shifts can explain with the help of the following table and diagram;
| Price (in Rs.) | Demand at Income (Y)=Rs. 150 | Demand at Y= Rs. 75 | Demand at Y= Rs. 300 |
| 5 | 30 | 15 | 60 |
| 10 | 15 | 7.5 | 30 |
| 15 | 10 | 5 | 20 |
In the given table, the demand schedule at a different level of income is given. The second column shows the initial demand schedule that shows various quantities of demand at different prices when income is Rs. 150. Now suppose income increases to Rs.300. The corresponding quantity demand at various same prices shown in the fourth column. From this, we realize that the quantity demand increases with an increase in income assuming the price remains the same. This is known as an increase in demand or a rightward shift in demand.
Again when there is a decrease in the level of income to Rs.75. The corresponding demand quantity at the same prices shows in the third column. From this, we realize that the quantity demand decrease with a decrease in income assuming the price remains the same. This is known as a decrease in demand or a leftward shift in demand.
This concept can be further understood with the help of the following diagram;
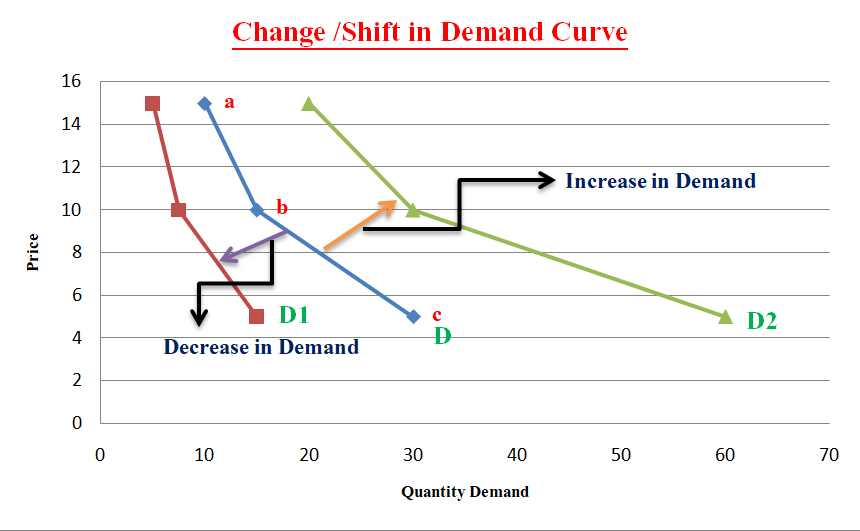
A change in one or more determinants of demand except for price, such as income, price of related goods, fashion, etc. will cause a change in demand. An increase in demand shifts the demand curve to the right, from D to D2. The rightward shifts in the demand curve represent that consumers are ready to purchase large quantities at constant prices due to changes in other determinants of demand (increase in income). A decrease in demand shifts the demand curve to the left from D to D1. This leftward shift in the demand curve indicates that consumers are willing to purchase less quantity at a constant price due to changes in other determinants of demand (decrease in income).
Thus, an increase in demand means that the entire demand curve shifts to the right, demonstrating a larger amount of purchases at every price.
The decrease in demand means that the entire demand curve shifts to the left, signifying the fewer amount of purchases at every price.
Causes of Shift/Change in Demand/Shifting Factors
Change or shift in demand may be an increase in demand or decrease in demand based on the nature of the effect of change in determinants of demand other than the price of the product. If there is a favorable or positive effect of change in determinants other than price then the demand curve will shift towards the right from its original position (increase in demand). And if there is an unfavorable or negative effect of change in determinants of demand other than price then the demand curve will shift to the left from its original position (decrease in demand).
Thus the cause of shift includes various non-price determinants of demand that cause shift/change in demand for the product. The following table shows the major shifting factors or causes of shift/change in the demand curve.
| Cause/Shift Factor | Increase in Demand/Rightward Shift | The decrease in Demand/Leftward Shift |
| Income of Consumer | Increase in income | Decrease in income |
| Price of Substitutes | Increase in the price of substitute goods | The decrease in the price of substitute goods |
| Price of Complements | Fall in the price of complementary goods | The rise in the price of complementary goods |
| Taste and Preferences | Favorable or positive change in taste and preferences. | An unfavorable or negative change in taste and preferences. |
| Price Expectations | The expectation of a rise in price soon | The expectation of a fall in price soon |
| Population | Increase in population | Decrease in population |
| Advertisement | Positive effects of advertisement | Negative effects of advertisement |
| Credit Facilities | More availability of credit facilities | No or less availability of credit facilities |
Difference between Movement along and Shift in Demand Curve or Change in Quantity Demand and Change in Demand
The major differences between change in quantity demand and change in demand (Movement and Shift in Demand Curve) can be shown with the help of the following table;
| Movement along with a demand curve/Change in Quantity Demanded | The shift in the demand curve/Change in Demand |
| It is due to a change in the price of the commodity only. | It is due to changes in all the determinants of demand other than price. |
| It is always shown along a similar demand curve. Thus there is no possibility of the formation of a new demand curve. | It is shown by drawing an entirely new demand curve. |
| The place of the demand curve remains the same. | The place of demand curve changes. |
| The effect on demand due to changes in price is reflected by expansion and contraction in demand. | The effect on demand due to change in other determinants except the price is reflected by an increase and decrease in demand. |
| Demand changes according to the law of demand. | Demand changes not according to the law of demand. |
| Price changes but all the other determinants remain constant. | Price remains constant but there is a change in all other determinants of demand. |
| Price-demand combinations move on different points of the same demand curve. | Price-demand combinations move at different points on different demand curves. |
Expansion of Demand versus Increase in Demand
The major differences between downward movement or expansion of demand and rightward shirt or increase in demand in the analysis of movement and shift in demand curve are following;
| Expansion of Demand | Increase in Demand |
| It refers to the larger quantity being purchased by the consumer due to a fall in the price of a commodity. | It refers to more demand at the same price. |
| The expansion of demand is due to a fall in the price of the goods. | An increase in demand is due to change or favorable change of other factors affecting demand except for the price. |
| It is related to movement along a demand curve. So it is shown by downward movement along the demand curve. | It is related to a shift in the demand curve. So it is represented by the rightward shift in the demand curve. |
Contraction of Demand versus Decrease in Demand
The major differences between upward movement/contraction of demand and leftward shirt or decrease in demand under the analysis of movement and shift in demand curve are following;
| Contraction of Demand | Decrease in Demand |
| Falls in the amount purchased due to an increase in the own price of the product. | A decrease in demand or a smaller amount of demand purchased at the same price. |
| It is due to an increase in the own price of the product. | It is due to the unfavorable or negative effect of determinants of demand other than price |
| It is shown by upward movement along the same demand curve. | It is exposed by a leftward shift in the demand curve. |