Contents
Concept of Income Elasticity of Demand
Consumer income is one of the significant determents of demand for a commodity as it determines the buyer’s ability to pay. Therefore, consumer’s demand for goods and services directly responds to the change in their income. Income elasticity of demand thus measures the degree of change in quantity demand as a result of some percentage or proportionate change in income of the consumers holding other factors affecting constant. In other words, it measures how much the quantity demanded changes concerning the change in income. In this article, we will discuss the concept and degree of income elasticity of demand.
Representing income elasticity of demand by EY the following formula shows its concept.
EY =Proportionate Change in Demanded of a Consumer/Proportionate Change in Consumer’s Income or EY= (∆Q/Q)/(∆Y/Y) = (∆Q/∆Y) *(Y/Q)
Where EY=Income elasticity of demand = Original quantity demanded; ∆Q= Change in quantity demanded; Y= Original Income; ∆Y= Change in Income
Example to Explain Income Elasticity of Demand
Suppose that the initial income of a person is Rs.10,000 and the quantity demand of the commodity by him is 500 units. When his income increases to Rs.12,000, the quantity demanded by him also increases to 700 units. Compute the coefficient of income elasticity of demand.
Solution:
Here,
Initial Demand (Q) = 500 units; New Demand (Q1) =700 units; ∆Q = (700-500) units = 200 units
Initial Income (Y)= Rs.10,000; New income (Y1) = Rs. 12000; ∆Y =Rs. (12,000-10,000) =Rs.2,000
Now,
EY =Proportionate Change in Demanded of a Consumer/Proportionate Change in Consumer’s Income
= (700-500)/500*100/ (12000-10000)/10000*100=40%/20%=2
Or
EY =(∆Q/∆Y) *(Y/Q) = (200/2000) *(10000/500) =2
Here the coefficient of income elasticity of demand is 2. It indicates that 1% increase in income leads to a rise of 2% in quantity demanded.
Types/Degrees of Income Elasticity of Demand
Depending on the numerical value of income elasticity of demand, income elasticity of demand can be categorized into the following degrees.
Positive Income Elasticity of Demand (EY>0)
If there is a positive or direct association between the income of the consumer and demand for the commodity, then it is the case of positive income elasticity. That is, if the quantity demand of a commodity increase with the rise in income of the consumer and vice versa, it is said to be a positive income elasticity of demand.
For example, when the income of consumers increases, they consume more superior (luxurious) goods. On the contrary, as the income of consumers decreases, they consume less luxurious goods. The positive relationship between the income of a buyer and the quantity demand of a good holds true for all the normal goods and luxurious goods. But it may not be the case for all the types of goods and services.
In the case of positive income elasticity of demand, the demand curve is upward sloping showing the positive and direct relationship between income and demand of the consumer. The following diagram shows the upward sloping income demand curve.
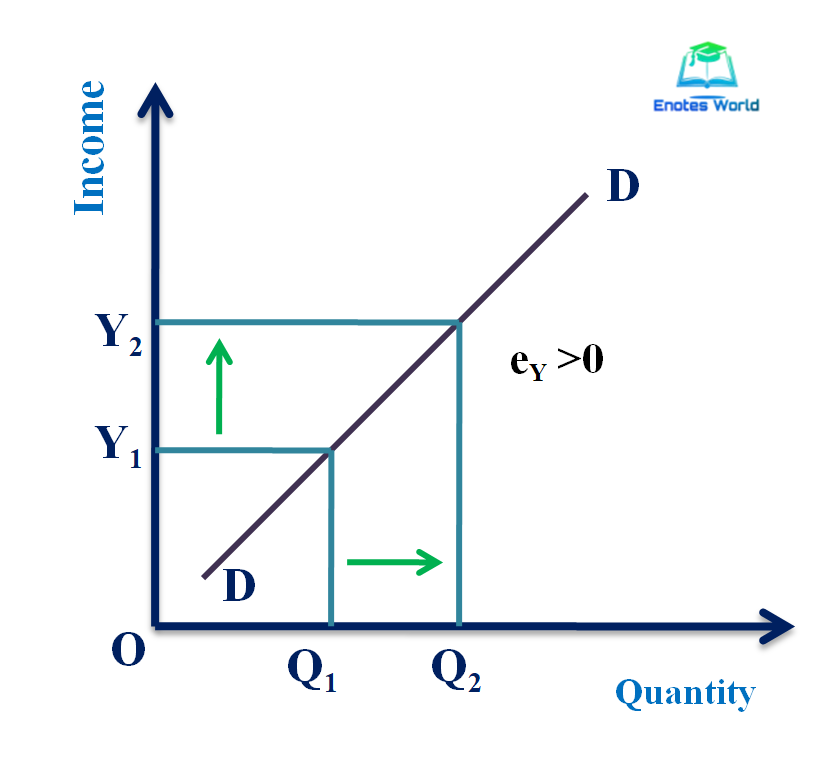
In the above figure, DD is the upward sloping income demand curve showing a direct relationship between the income of the consumer and their demand. When income increases from Y1 to Y2, quantity demand has also increased from Q1 to Q2. Here both of the changes are in the same direction, so it generates positive income elasticity. This type of elasticity is found in commodities of normal life and luxurious life.
Positive income elasticity has additionally been categorized into the following three types.
- Income elasticity greater than one (EY > 1)
- Income elasticity equal to one (EY = 1)
- Income elasticity less than one (EY < 1)
Income elasticity is greater than one or relatively elastic income demand (EY > 1)
If the lesser proportionate change in income results in a comparatively larger proportionate change in quantity demand of a commodity, it is said to be income elasticity of demand is greater than one or relatively elastic income demand or simply income elastic demand. For instance, a 7% rise in income leads to an 11 % rise in demand, it is the case of income elasticity greater than one. This embraces corrects for luxury goods or goods of comfort. The elastic income demand curve is upward sloping and flatter in the case of relatively elastic income demand. The following diagram shows the elastic income demand curve.
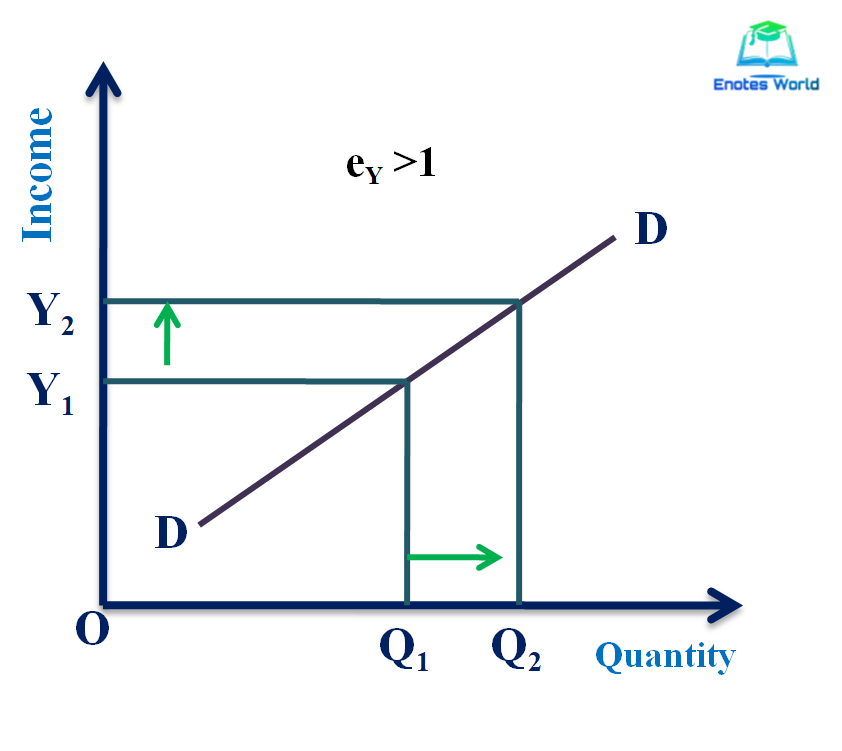
In the above figure, DD is the upward sloping elastic income demand curve. It is flatter showing that the percentage increase in quantity demand is higher than that of income. The distance between Y2 and Y1 shows the proportionate change in income (∆Y) similarly the distance between Q1 and Q2 shows the proportionate change in quantity (∆Q). Here ∆Q is greater than ∆Y. Thus, this case shows the elastic income demand.
Income elasticity less than one or relatively inelastic demand (EY < 1)
When the bigger proportionate change in income carries a relatively minor proportionate change in quantity demand of the consumer, then it is inelastic income demand or income elasticity of demand less than one or relatively inelastic income demand. For instance, if the consumer’s income upsurges by 6% and as a result the demand grow by 3%, it is the case of income elasticity less than one. It is true for the necessary goods and demand curve in the inelastic demand case is steeper and upward sloping. The following graph shows the inelastic income demand curve.
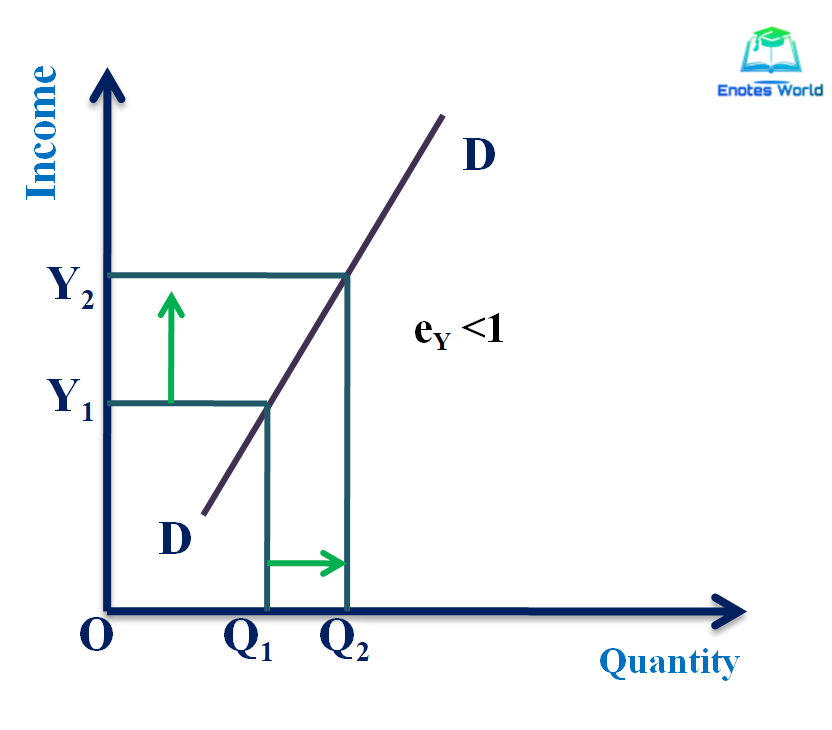
In the above figure, DD is the upward sloping inelastic income demand curve. It is steeper showing that the percentage increase in quantity demand is lower than that of income. The distance between Y2 and Y1 shows the proportionate change in income (∆Y) and similarly, the distance between Q1 and Q2 shows the proportionate change in quantity (∆Q). Here ∆Q is smaller than ∆Y. Thus, this case shows the inelastic income demand of the good.
Income elasticity equal to one or Unitary elastic demand (EY = 1)
If the percentage change in income and the percentage change in demand quantity are identical then it is the case of income elasticity is equal to one. For instance, growth in income by 5% leads to the growth of demand exactly by 5% then it is the case of income elasticity equal to one or unitary income elasticity. This case is considered as a happy accident and might hold in the case of comfort goods. The demand curve, in this case, is the 45oline showing an equal percentage change in income and demand of the consumers. The following figure shows such an income demand curve.
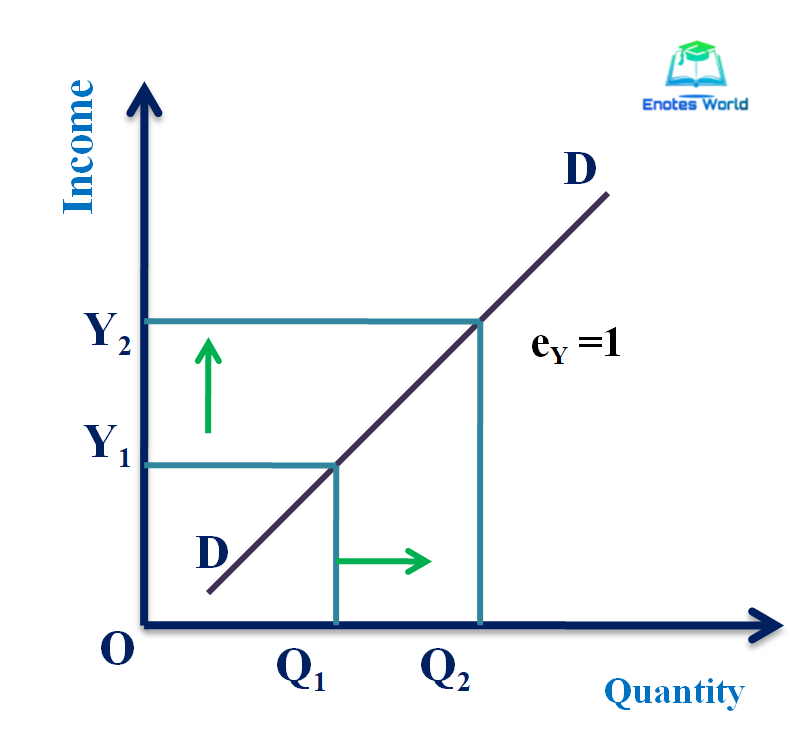
In the above figure, DD is the upward sloping unitary elastic income demand curve. It is 45o upwards sloping line showing that the percentage increase in quantity demand is the same as that of income. The distance between Y2 and Y1 shows the proportionate change in income (∆Y) and similarly, the distance between Q1 and Q2 shows the proportionate change in quantity (∆Q). Here ∆Q is equal to ∆Y. Thus, this case shows the unitary elastic income demand of the good.
Negative Income Elasticity (EY<0)
The income elasticity becomes negative when an increase in income of the consumers leads to a fall in the amount of purchase and vice versa. It means when there is an opposite relationship between the income of the consumer and demand for the commodity, then income elasticity will become negative. For instance, as the income of consumers increases, they either stop or consume less inferior goods. In this case, the demand curve is downhill sloping and it holds for Giffen or inferior goods. The following diagram shows the negative income demand curve.
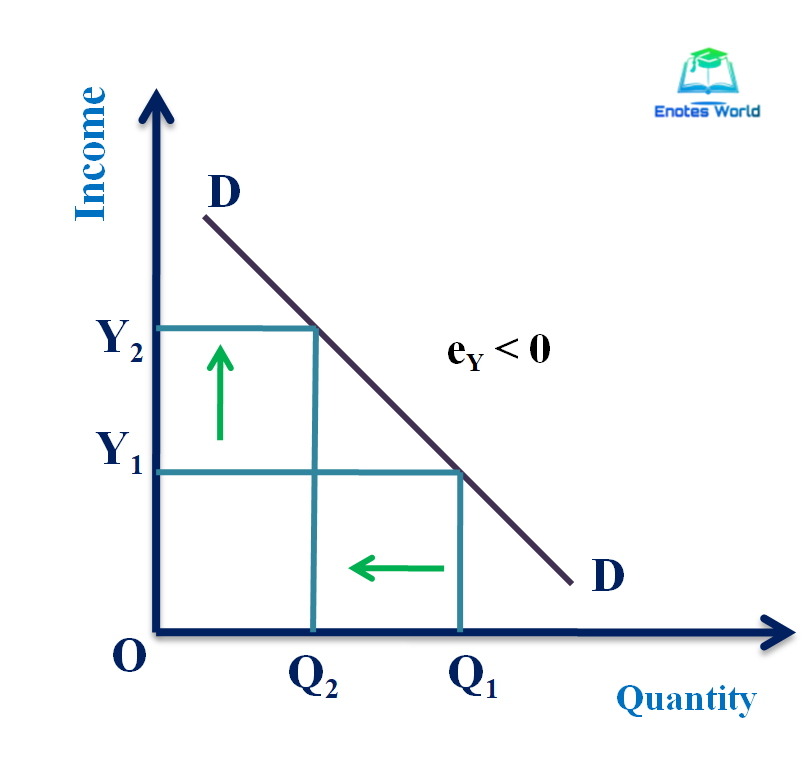
In the above figure, DD is a downward sloping income demand curve showing an indirect or inverse relationship between the income of the consumer and demand for goods and services. When there is an increase in consumer’s income, then they will purchase less amount of inferior or low-quality goods and move towards high quality or luxurious goods. In the figure, when income increases from Y1 to Y2, the consumer’s demand has decreased from Q1 to Q2 as they have started to shift their consumption towards superior quality goods with an increase in income.
Zero Income Elasticity of Demand (EY=0)
The income elasticity of demand may be zero in some cases. Zero income elasticity of demand implies to the case in which there is no change in demand for the product at all the level of income. It means if the quantity demand of a commodity remains persistent with any rise or fall in income of the consumer then, it is said to be zero income elasticity of demand. For instance, in the case of basic necessary goods or neutral goods such as salt, kerosene, electricity, etc. there is zero income elasticity of demand. The demand curve, in this case, is a vertical line.
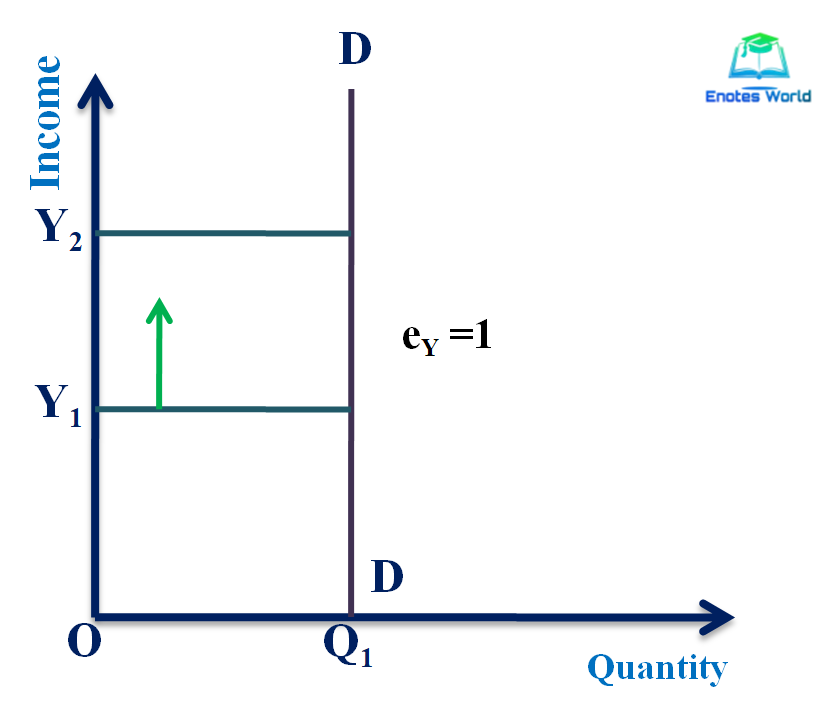
The vertical line DD is the demand curve representing zero income elasticity of demand. When there is an increase in the income of the consumers from Y1 to Y2, the demand quantity remains as it is at the OQ level. This indicates that the quantity demanded remains constant for all levels of income.
The following table summarizes the description of the concept of the degree of income elasticity of demand.
| Numerical Measure/Degree | Description | Application |
| Positive | Quantity demand increases as income increases. | Normal and luxurious goods |
| Greater than zero but less than one | Quantity demand increases less than in proportion to the increase in income. | Necessities |
| Greater than one | Quantity demand rises more than in proportion to the increase in income. | Luxurious goods |
| Unity | Quantity demand rises in the same proportion as the rise in income. | Comfort goods |
| Negative | Quantity demand decreases with an increase in income. | Inferior goods |
| Zero | No change in quantity demand with an increase in income | Inexpensive essential goods. |
Conclusion
Income elasticity of demand measures the degree of responsiveness of the quantity demand of a commodity to a change in the income of the consumers. It quantifies the effect of change in income on the consumer’s purchase decision keeping other affecting factors constant. Based on the mathematical value or coefficient of income elasticity it can be categorized into three different types. The concept and degree of income elasticity of demand have shown us that there is a different degree of effect of income in the demand of different nature of goods. Therefore, understanding of the concept and degree of income elasticity of demand is needed for identification of different types of goods, and other business as well as policy formulation decisions.
References and Suggested Readings
Adhikari, G.M. and et.al. (2019). Microeconomics for Business. Kathmandu: KEC Publication
Dhakal, R. (2019). Microeconomics for Business. Kathmandu: Samjhana Publication Pvt. Ltd.
Mankiw, N.G. (2009). Principles of Microeconomics. New Delhi: Centage Learning India Private Limited
Salvatore, Dominick. (2003). Microeconomics: Theory and Application. Oxford University Press, Inc.
Shrestha, P.P. and et.al. (2019). Microeconomics for Business. Kathmandu: Advance Sarswati Prakashan.