The degree of price elasticity of demand for different goods is different. So, it is important to measure the elasticity of demand to compare the elasticity of demand for different goods. Economists have developed different, methods of measurement of price elasticity of demand. Here we will discuss all the major methods of measurement of price elasticity of demand. The following are the major methods of measurement of price elasticity demand as suggested by different economists.
- Percentage or Proportion Method
- Total Outlay or Total Expenditure Method
- Point Method or Geometric Method
- Arc Method
The following section includes a short explanation of all the methods of measurement of price elasticity of demand.
Contents
Percentage or Proportion Method
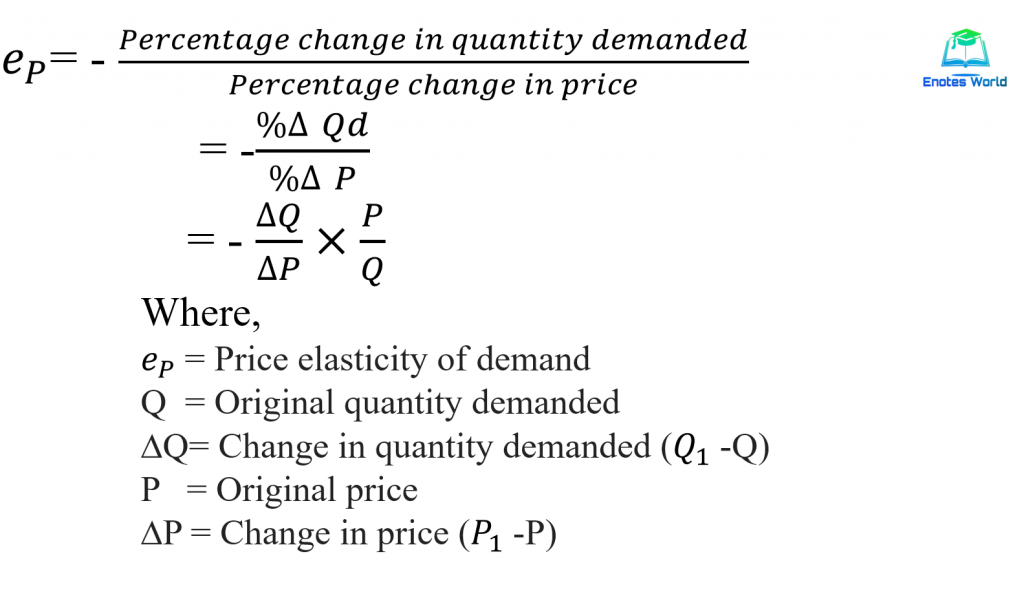
The percentage or proportionate method measures the price elasticity of demand by dividing the percentage or a proportionate change in quantity demanded by the percentage or a proportionate change in the price of the product. It applies the following formula to compute the coefficient of price elasticity of demand;
Example of Measurement of Price Elasticity of Demand by Percentage/Proportion Method
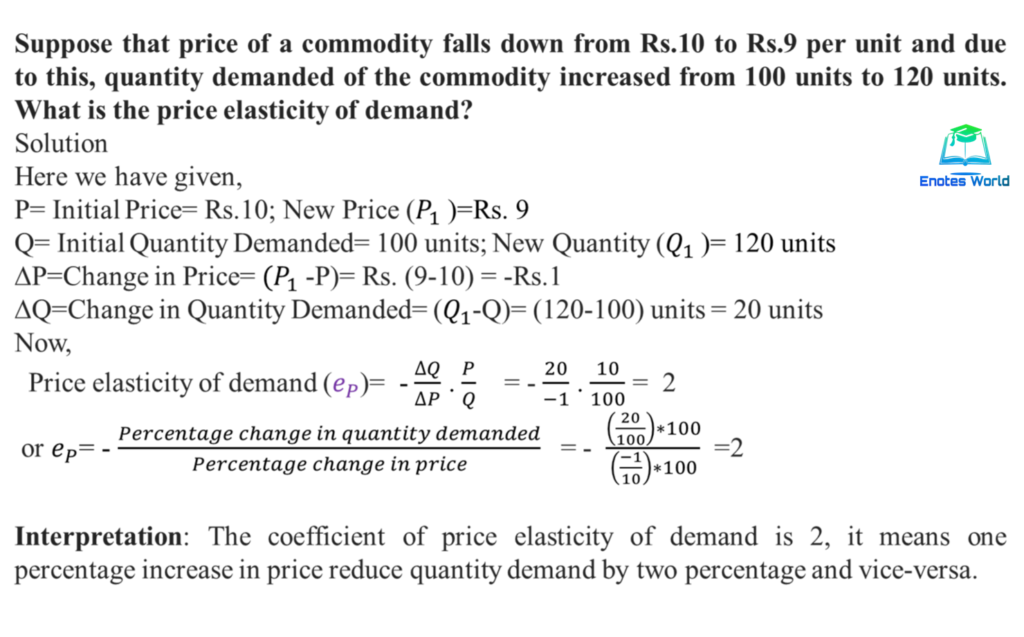
While using a percentage or proportion method of measuring price elasticity of demand, its formula includes a negative sign as there is an inverse relationship between price and quantity demand of the commodity. Hence the computation of price elasticity of demand always results in a negative sign coefficient of elasticity. Similarly, the percentage method of measurement of price elasticity of demand is a unit free measurement as it only considers the percentage change of price and the resulting percentage change in quantity demanded. The measurement of quantity whether in kg or liter and the measurement of price whether in Chinese Yen or the US dollar it does not matter. Thus, we can easily compare the price elasticity of demand regardless of the units for measuring either price or quantity. This is the most significant advantage of the percentage method of measuring price elasticity of demand.
Another advantage of this method is that it gives a precise and exact measure of elasticity. A larger coefficient of elasticity says that demand is more sensitive towards changes in price and a small value of the coefficient of price elasticity indicates that the quantity demand is not that much price sensitive.
However, one of the issues of using this method is that the percentage change depends on the base or the starting point. Should we charge the initial price or quantity as the starting point is a considerable matter? But if we consider two points on the demand curve and we take two of them as starting points one another after then the value of elasticity will differ in both calculations based on which one, we have taken as a starting point.
Total Outlay or Total Expenditure Method
Among the methods of measurement of price elasticity of demand, the other one is the total outlay or total expenditure method suggested by Alfred Marshall. Under the total outlay method, price elasticity of demand is measured by observing the direction of change in total expenditure in response to a change in price. it means, the elasticity of demand in the total expenditure method can be computed by seeing the change in price and the following change in the total quantity of goods purchased and the total amount of money spent or total expenditure ended on it.
Total outlay or Total Expenditure is the expenditure incurred by households on the purchase of a commodity. It is the product of price and quantity demanded at that price, i.e., TE= P*Q
Where TE refers to total expenditure, P and Q stand for price and quantity respectively. For instance, if 10 units of a commodity are demanded when its price is Rs. 5, the total outlay will be Rs. 50.
As we already mentioned earlier, this method measures the elasticity of demand considering the change in total spending incurred on a commodity as a result of the change in the price of the commodity. By using this method, we can sort three types of elasticities.
Elastic Demand
When a decrease in the price of the commodity results in an increase in total expenditure and an increase in the price leads to a decrease in total expenditure, the elasticity of demand will be greater than one and called elastic demand. So, when total expenditure moves in the opposite direction to the change in price, the elasticity of demand is greater than unitary. There is an inverse relationship between the change in the price of the goods and the corresponding change in the total expenditure of a buyer on that good, then the demand is relatively elastic or elastic or elasticity greater than unity. Following schedule and graph help to understand the nature of elastic demand.
| Price (P) | Demand (Q) | Total Expenditure (P*Q) |
| 60 | 10 | 600 |
| 50 | 13 | 650 |
Here there is an inverse relationship between the direction of change in price and change in total expenditure. Fall in price from Rs. 60 to Rs. 50 has increased the total outlay of a consumer from Rs. 600 to Rs. 650. This case shows elasticity is greater than unity.
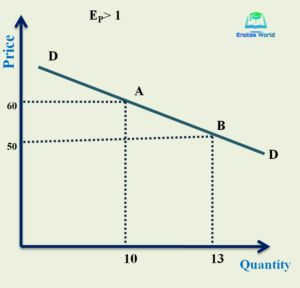
In the figure, the demand curve DD is elastic demand showing an increased change in total expenditure with a decrease in the price of the commodity. Therefore, the area of rectangle OB is greater than the area of OA in a demand curve DD. In another way, we can say that the decrease in price represented by the area of Rs. 60 to 50 is less than the increase in demand represented by the area of 10 to 13 units. Thus this is the case of elastic demand.
Inelastic Demand
When the decrease in the price of the commodity resulted in a reduction in total expenditure and an increase in price increased total expenditure then the price elasticity of demand will be less than unitary, relatively inelastic, or inelastic. Thus, when total expenditure moves with a change in price in a positive direction then it is inelastic demand. In another world, inelastic demand is the case in which there is a positive or direct relationship between the price of the good and the total expenditure of a buyer on that good. The following table and graph illustrate the inelastic demand case in the total outlay method.
| Price (P) | Demand (Q) | Total Expenditure (P*Q) |
| 60 | 10 | 600 |
| 50 | 11 | 550 |
The schedule shows demand is inelastic. It is because of a fall in price from Rs. 60 to Rs. 50, total expenditure also falls from Rs. 600 to Rs. 550. This information will also reveal the following graph.
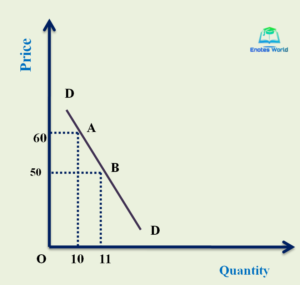
In the graph, the DD demand curve is inelastic. The area of rectangle OB is less than the area of rectangle OA. Similarly, we can say that the decrease in price represented by the area between Rs. 60 to 50 is higher than the increase in demand represented by the area of 10 to 11 units. Thus it is the case of inelastic demand.
Unitary Elastic Demand
When the total expenditure does not vary with a change in the price of the commodity, the elasticity of demand is equal to unit or unitary. In such a case, a change in the quantity demanded just offsets the change in price. therefore, the rise or fall in the price of a good does not change the total expenditure of households in the case of unitary elasticity of demand under the total outlay method. The following schedule and graph will show the concept of such a type of elasticity of demand.
| Price (P) | Demand (Q) | Total Expenditure (P*Q) |
| 60 | 10 | 600 |
| 50 | 12 | 600 |
In the schedule, we can see there is no change in total expenditure with a change in the price of the commodity. When there is a decrease in price from Rs. 60 to Rs. 50 then there is no change in total expenditure. The following diagram shows the unitary elastic demand curve.
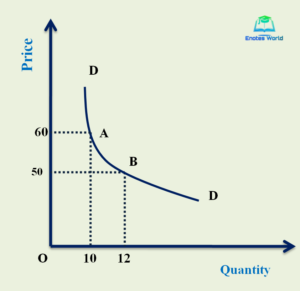
In the diagram, the demand curve DD shows unitary elastic demand under the total outlay method. The demand curve is rectangular hyperbola in shape and OA and OB are equal showing the change in price does not bring any change in the total expenditure of a household.
In summary three categories of price elasticity of demand under total outlay method are given below;
| Change in Price | Unitary Elastic | Elastic | Inelastic |
| Fall in price | TE remains the same | TE increases | TE falls |
| Rise in price | TE remains the same | TE decreases | TE increases |
The relationship between elasticity of demand and total expenditure can be shown with the help of the following figure.

The diagram shows the total expenditure on the X-axis and the price of the Y-axis. AB is the total expenditure curve. When the price of the commodity decreases from OP to OP1, the total outlay rises from OM to OM1. So, the elasticity of demand is more than unitary in such a case. Again, with a decrease in price from OP1 to OP2, the total outlay remains as it is or the same at the level of OM1. Therefore, elasticity in such a part is equal to unitary.
Finally, with the decrease in price from OP2 to OP3, the total outlay also falls from OM1 to OM. This has shown that the elasticity of demand is less than unitary or inelastic demand. Thus, between AD elasticity of demand is greater than unitary or elastic demand; between DE elasticity is unitary and between EB, it is less than unitary or inelastic demand.
Under the total outlay method, the measurement of elasticity only lets us know whether it is unitary, greater, or less than unitary. It means the total outlay method does not tell us the exact coefficient of elasticity. So, unlike the percentage or proportionate method, the total expenditure method is not the precise or exact method of measuring price elasticity.
Point Method or Geometric Method
The point method of measurement of price elasticity of demand is also known as the geometric method was developed by prof. Alfred Marshall. This method is used to measure the price elasticity of demand at any given point in the demand curve. Thus, the method for measuring elasticity at a finite(particular) point on a demand curve is identified as the point method.
Specifically, the point method is the measure of the proportionate change in quantity demanded in response to a very small(negligible) proportionate change in price. So, this method is suitable when a change in price and the consequent change in quantity demanded are very small.
Point elasticity may be symbolically expressed as
ep=ΔQ/ΔP*P/Q——–(I)
Where,
ep= Price elasticity of demand; ΔQ= Small change in quantity demand; ΔP = Small change in price; P= Initial price; and Q= Initial quantity.
Generally, there are two types of demand curves as Linear demand curve and Non-linear demand curve. The following section explains point elasticity in different demand curves.
Point Elasticity and a linear demand curve
The linear demand curve infers the same slope throughout the entire demand curve. Under this method, the demand curve is extended to touch the X-axis and Y-axis. After this we use the following formula to calculate point elasticity:
ep at any point= (Lower segment of the demand curve)/ (Upper segment of the demand curve)
That is, ep=ΔQ/ΔP*P/Q————- (II)
Proof:
Let us take a point on a linear demand curve and measure the elasticity of demand at that particular point. Let, DD1 be a given linear demand curve and we are interested to calculate elasticity at point R on the given demand curve.
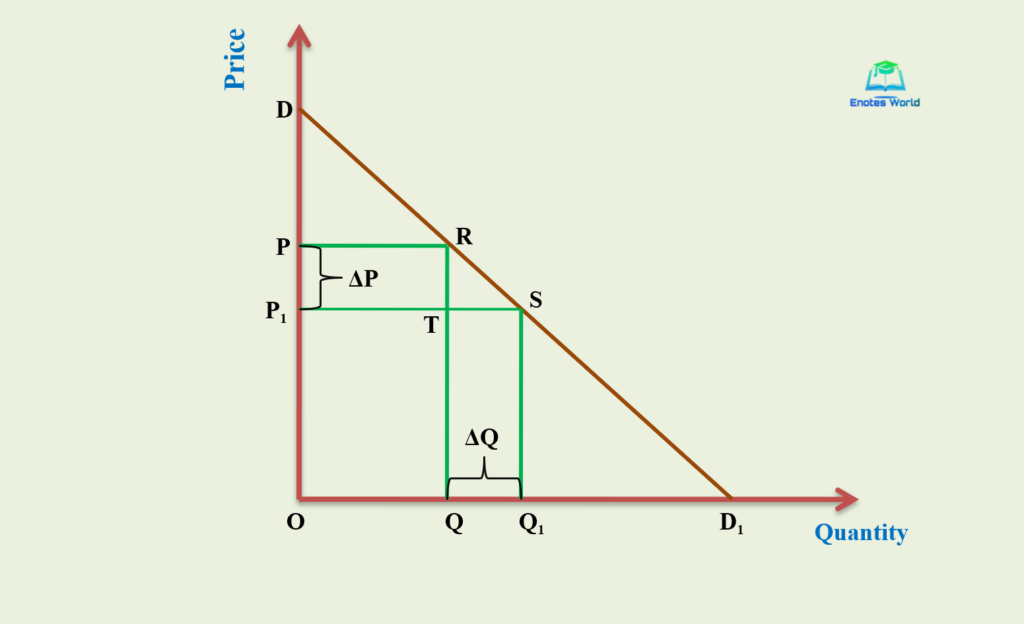
In the above figure, DD1 is a straight-line demand curve or linear demand curve which touches both the axis. Initial price P= OP, and initial quantity Q=OQ. When the price decreases from OP to OP1, the quantity demanded increases from OQ to OQ1. Then from the figure, we have a change in price (ΔP)=PP1, change in quantity (ΔQ)=QQ1. Substituting these values in equation (II) we get,
ep=QQ1/PP1*OP/OQ————- (III)
Again, from our figure, QQ1=TS, PP1=RT (being the opposite sides of a rectangle). Substituting these values in equation (III) we get,
ep=TS/RT*OP/OQ————- (IV)
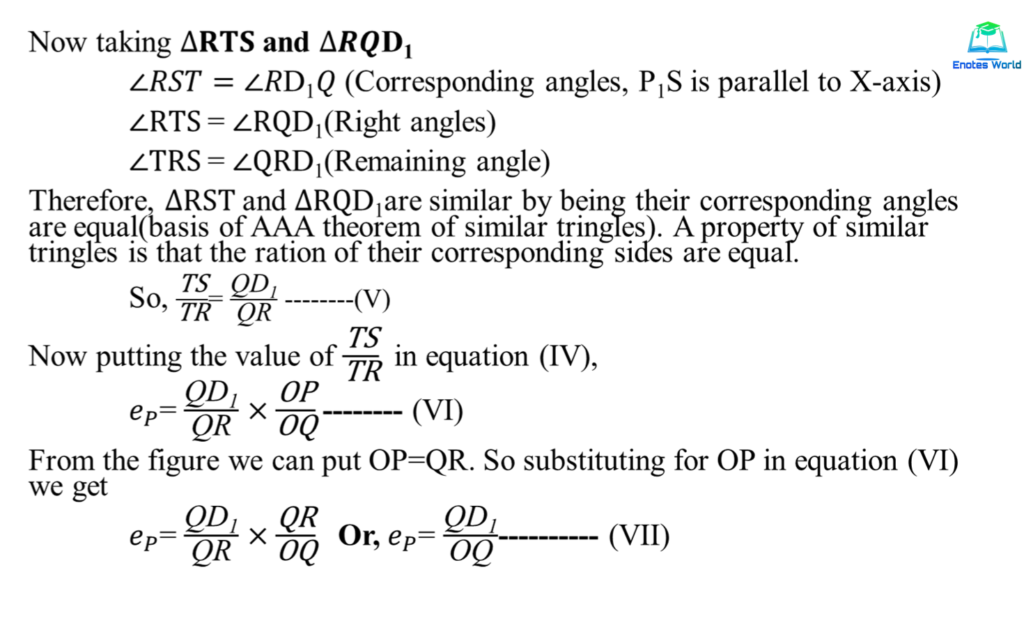
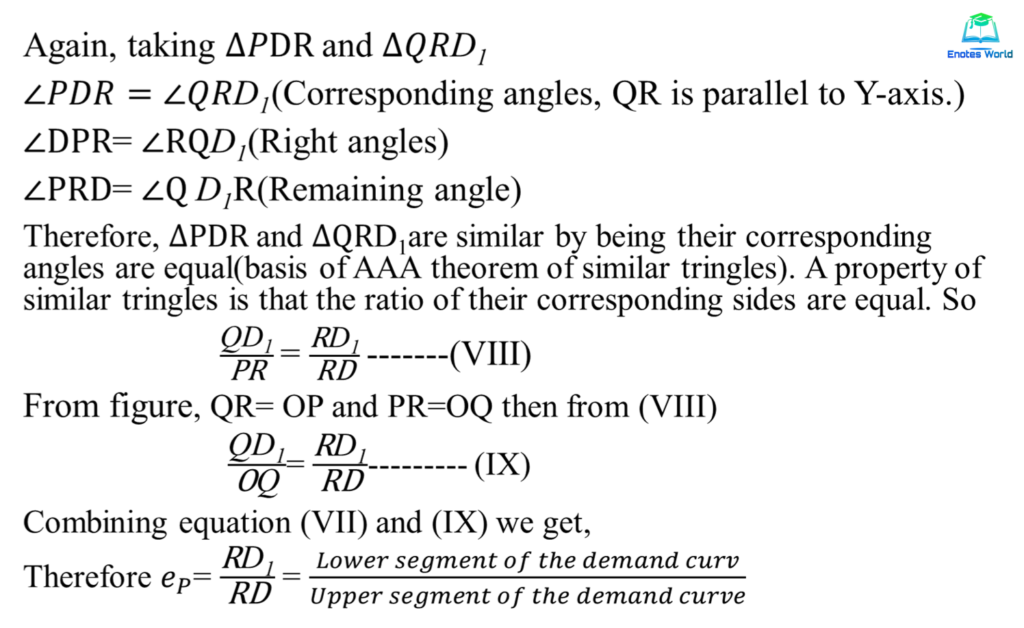
Therefore, the formula ep=ΔQ/ΔP*P/Q measures the price elasticity of demand at a particular point of the demand curve. If we are given the length of the segment of the linear demand curve then we can find out the elasticity of demand by taking the ratio of the length of the segment to the right of the point to the length of the segment to the left of the point.
Different Elasticities along a linear demand curve
In a linear demand curve, the value of point price elasticity of demand is different at different points on the demand curve. It can take value from zero to infinity. The following graphical presentation shows different elasticities along a linear demand curve;
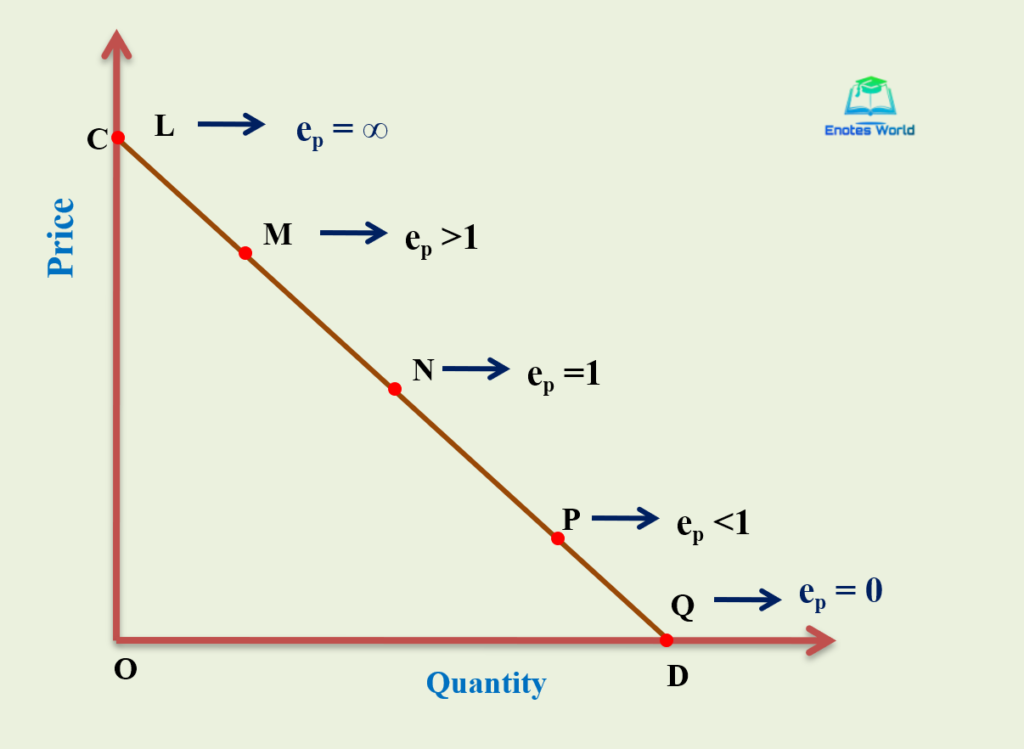
In the above figure five points L, M, N, P, and Q are taken on the given linear demand curve. The elasticity of demand at each point can be identified with the help of the above method. Suppose the N point is in the exact center of the given demand curve. So, the elasticity of demand at point N is unitary. It is because at the mid-point of the demand curve the lower segment and upper segment of the demand curve are equal.
Thus,
- ep at point N= (Lower segment of the demand curve)/ (Upper segment of the demand curve) = DN/NC=1.
- At any point to the right of the mid-point (for example point P) the point elasticity of demand is less than unitary which means demand is inelastic or less elastic. This is because to the right of the mid-point of the demand curve, the lower segment is shorter than the upper segment.
- Any point left to the mid-point of the demand curve (for example at point M) the point elasticity of demand is greater than unitary means demand is more elastic.
- At the point where the demand curve meets Y-axis (for example point L), the point elasticity is infinity. This is because the whole length of the demand curve will be the lower segment and the value of the upper segment is zero.
- At any point where the demand curve meets the X-axis (for example point Q), the point elasticity is zero. This is because the whole length of the demand curve is covered by the upper segment and the lower segment is zero.
Point Elasticity of demand and a non-linear demand curve
The nonlinear demand curve infers different slopes at different points throughout the demand curve. If the demand curve is non-linear then the price elasticity of demand at a point on it can be measured by drawing a tangent line to that point and then apply the price elasticity formula;
ep at any point= (Lower segment of the demand curve)/ (Upper segment of the demand curve)
The following figure shows the non-linear demand curve and method of measurement of point price elasticity of demand at different points of the demand curve.
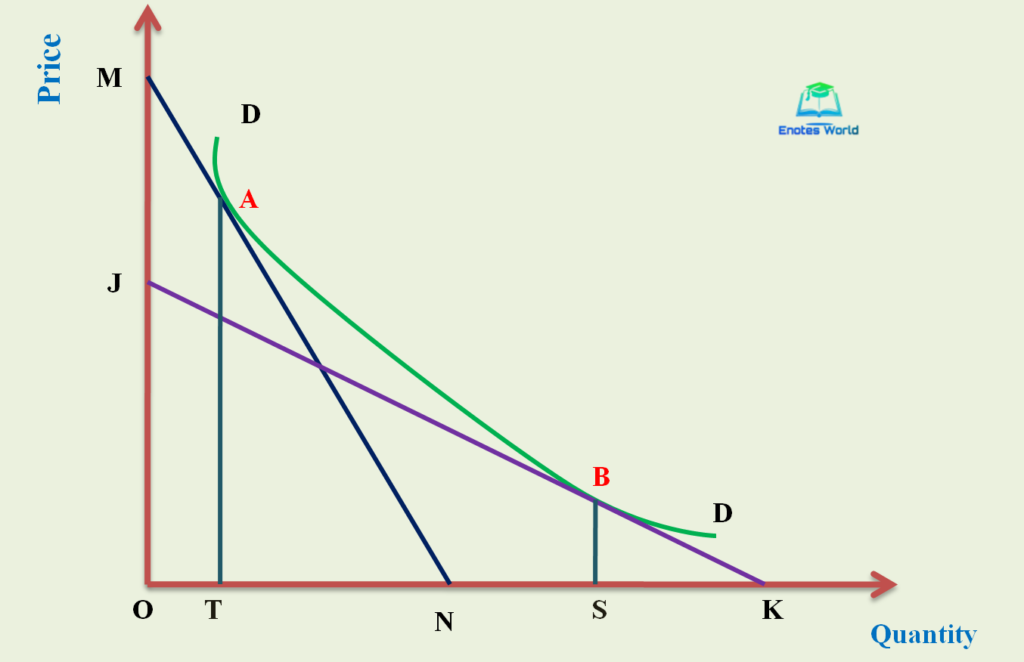
In the figure, DD is the non-linear demand curve. Price elasticity at point A on it can be computed by drawing a tangent line MN to point A. Then price elasticity of demand at point A is;
ep at point A= TN/AT*AT/OT= TN/OT, the elasticity is greater than one or the demand is more elastic.
Similarly, point elasticity at point B can be computed by drawing a straight-line JK tangent to point B on the demand curve DD. The elasticity can be computed with the following formula;
ep at point B= SK/BS*BS/OS= SK/OS, the elasticity is less than one or the demand is less elastic.
Average/Arc/Mid-Point Method of Measurement of Price Elasticity of Demand
The point method of measurement of price elasticity of demand is not accurate as we cannot get the information on very small changes in price and quantity demanded in the market. Thus, in the case of a large change in price and quantity or a time-lagged change in price, the point method is not suitable to measure the price elasticity. To avoid these defects, the arc method of measurement of price elasticity of demand is taken as an alternative method to calculate price elasticity.
Here the term ARC refers to the section or portion of a demand curve between two points. The arc method considers the average value of the initial and final values of price and quantities to measure the elasticity coefficient. Thus, it is also known as the Average Elasticity Method or Mid-Point Method. To calculate price elasticity, first, we take the mid-point or average of prices and quantities as:
Average or Mean or Mid-point of price P= (P1+P2)/2
Average or Mean or Mid-point of quantity Q= (Q1+Q2)/2
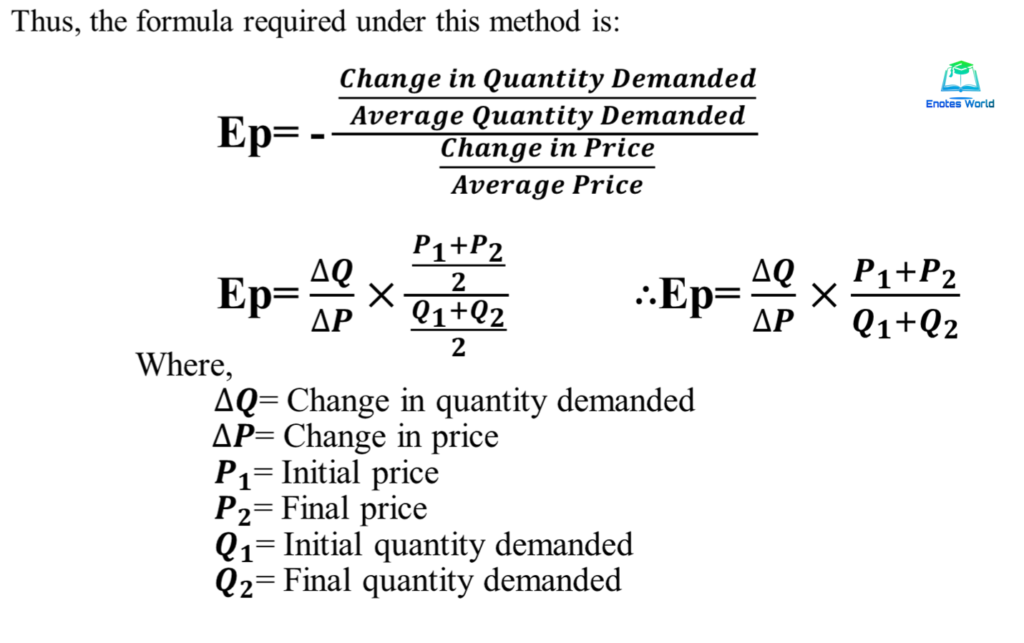
The following figure and subsequent explanation show the detail regarding the measurement of price elasticity of demand under the arc method.
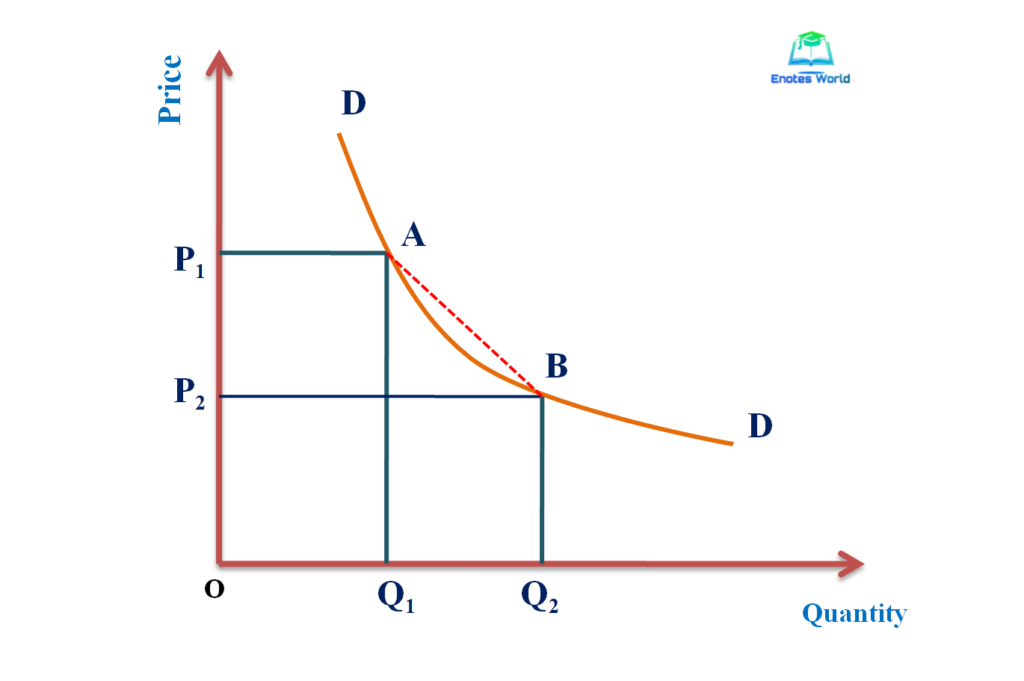
In figure DD is the demand curve and based on the change in price and quantity, ep is calculated and which has the same value from A to B or from B to A because we take the average values while calculating the coefficient of elasticity. Thus, under such a method, the movement from A to B or movement from B to A gives the same value of ep.
Thus, the point method of measurement of price elasticity of demand is used in the case when the changes in price and quantity are small but we use the arc method to measure the elasticity of demand when the change in price and quantity is relatively large. When the elasticity has to measure over some range or arc along a demand curve rather than at a particular point, the point elasticity does not provide the true and correct magnitude of price elasticity of demand.
So, we have to use the arc method to measure the price elasticity of demand when the change in price and quantity is larger. Arc method is more suitable to use because of its technique. In the case of the non-linear demand curve, the use of the arc method is more suitable. We have to keep in our mind that the arc elasticity measure takes into account the midpoint of the chord that connects the two points on the demand curve.
References and Suggested Readings
Adhikari, G.M. and et.al. (2019). Microeconomics for Business. Kathmandu: KEC Publication
Dhakal, R. (2019). Microeconomics for Business. Kathmandu: Samjhana Publication Pvt. Ltd.
Mankiw, N.G. (2009). Principles of Microeconomics. New Delhi: Centage Learning India Private Limited
Salvatore, Dominick. (2003). Microeconomics: Theory and Application. Oxford University Press, Inc.
Shrestha, P.P. and et.al. (2019). Microeconomics for Business. Kathmandu: Advance Sarswati Prakashan.