The basic economic problems and their nature can be explained with the help of a diagram named the production possibility curve(PPC). Since the resources are limited, demand and things to be produced are unlimited. So society has to decide about the goods to produce: wheat, cloth, roads, electrical goods, etc. After deciding the nature of goods that are to be produced, then the next task is to identify their quantities too.
The production possibility curve (PPC) shows the maximum possible quantity of goods to be produced by using limited resources. A production possibility curve determines the utmost production of any two goods using a given and fixed amount of input.
In the words of Samuelson, “Production possibility curve is that curve which represents the maximum amount of a pair of goods or services that can both be produced with an economy’s given resources and technique, assuming that all the resources are fully utilized.”
A graphical representation of the maximum level of output that an economy can achieve with full utilization of the existing resources is called PPC. In the next words, the Production Possibility Curve (PPC) is a graphical illustration showing all the possible combinations of goods that an economy can produce with full employment of available resources within a specific period. The alternative names of PPC are production possibility frontier or product transformation curve. PPC shows the trade-off between producing any two goods.
Assumptions
The Production Possibility Curve (PPC) is based on the following assumptions;
- The economy is producing only two goods
- Fixed resources/factors of production are fixed or unchanged
- There is full employment of resources
- Production technology is given and fixed
- The time is given
- Short-run basis
- Resources are not uniformly competent and efficient in the production of all goods.
Contents
Derivation of Production Possibility Curve (PPC)
Based on the assumptions, we can derive the Production Possibility Curve (PPC) with the help of a hypothetical production possibility schedule. The production possibility schedule is a table that shows the maximum possible combinations of two goods that can be produced with fuller use of available resources.
Suppose that an economy produces two goods- consumer goods and capital goods. The various combinations of the possible production of these two goods can be shown in the following table;
| Combinations | Consumer goods(‘000’MT) | Capital goods (‘000’MT) | The marginal opportunity cost of consumer goods(capital goods) |
| A | 0 | 15 | – |
| B | 1 | 14 | 1 |
| C | 2 | 12 | 2 |
| D | 3 | 9 | 3 |
| E | 4 | 5 | 4 |
| F | 5 | 0 | 5 |
If all the available resources are fully utilized to produce capital goods, an economy can produce 15 units and no consumer goods. Likewise, if these resources are used to produce only consumer goods, it can produce 5 units of it and no capital goods as represented by combination A and F.
All the other combinations show that the economy can produce a combination of both goods. However, due to the scarcity of resources, the production of consumer goods cannot be increased without decreasing the production of capital goods and this is called a trade-off between these two goods.
If we present the production possibility schedule in the graph we will get the production possibility curve as below;
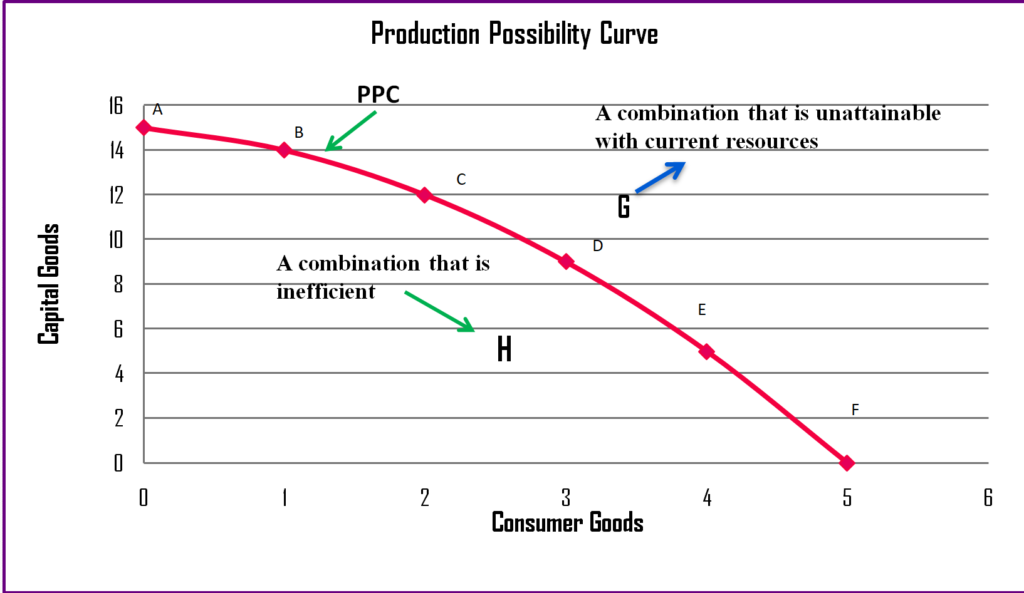
The figure shows PPF or PPC. By joining different six combinations we got the downward sloping curve known as PPC. So PPC is the curve that shows various his curve represents all the alternative combinations of consumer goods and capital goods that an economy can produce using its fixed resources and given level of technology.
It shows the consumer’s menu between available two goods. If we consider the given production possibility schedule and curve we can see that to increase the output of any one good the resources from other goods should be diverted or transferred otherwise such addition is not possible. Therefore, it is sometimes called the transformation curve as well.
Shape of PPC
It is the opportunity cost that decides the shape of PPC. Opportunity cost is the given up amount of one good (Capital Goods) to produce one more unit of another good (Consumer Goods).
When the opportunity cost is decreasing, the PPC is convex (Inward expanding), when the opportunity cost is constant, the PPC is a straight line and when the opportunity cost is increasing, the PPC would be concave to the origin.
Thus, the PPC where there is an increase in opportunity cost is called increasing cost PPC. If the opportunity cost remains constant, then PPC is called constant cost PPC.
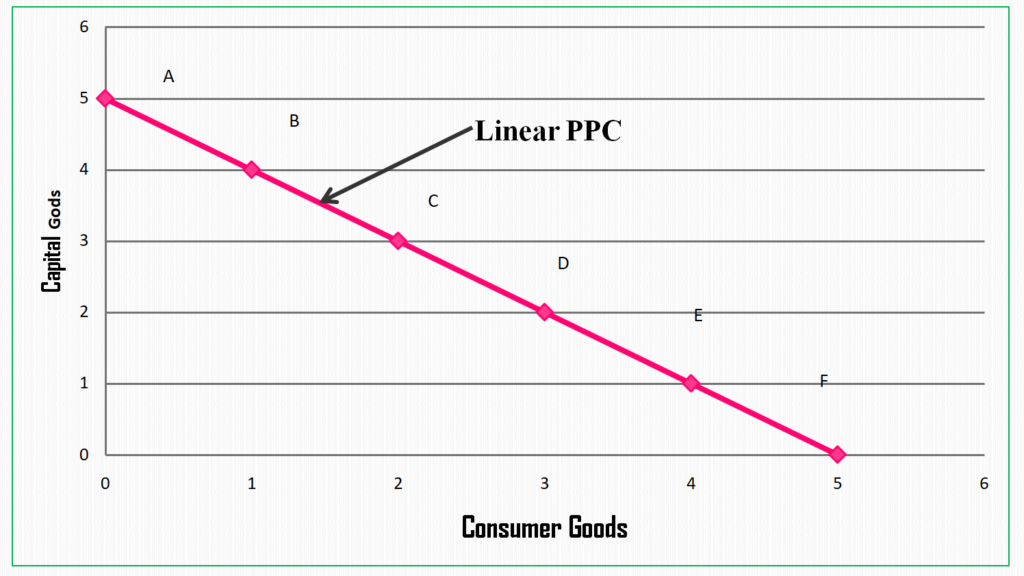
Production possibility schedule with constant opportunity cost
| Combinations | Consumer goods(‘000’MT) | Capital goods (‘000’MT) | The marginal opportunity cost of consumer goods(capital goods) |
| A | 0 | 5 | – |
| B | 1 | 4 | 1 |
| C | 2 | 3 | 1 |
| D | 3 | 2 | 1 |
| E | 4 | 1 | 1 |
| F | 5 | 0 | 1 |
In the table we can see the given up amount of resources from the production of capital to produce every one more consumer goods (marginal opportunity cost of consumer good) is equal. If we show the above production possibility schedule in the graph we will get the straight line PPC. The straight line PPC is not practically fitted.
It is because resources are not equally efficient in the production of all the goods. Thus the producer (economy) will transfer more and more resources towards the production of suited goods from less suited goods. This will require increasing opportunity cost and there would not be a case of constant opportunity cost. So it always slopes downwards and concaves from the origin. Secondly, it is always drawn as a curve so it cannot be a straight line.
The Shift in PPC
The movement of PPC from its initial position to inward and outward position due to various reasons is called the shift in PPC.
The production possibility of an economy changes over time. In the long run, technological progress may take place through new inventions. Learning and training, as well as education, can make the labor force more productive. New raw materials may be discovered. All these factors lead to an increase in the production capacity of a nation and such an increase in productive capacity shifts the PPC outward.
The shift in PPC can be shown in the following graph;
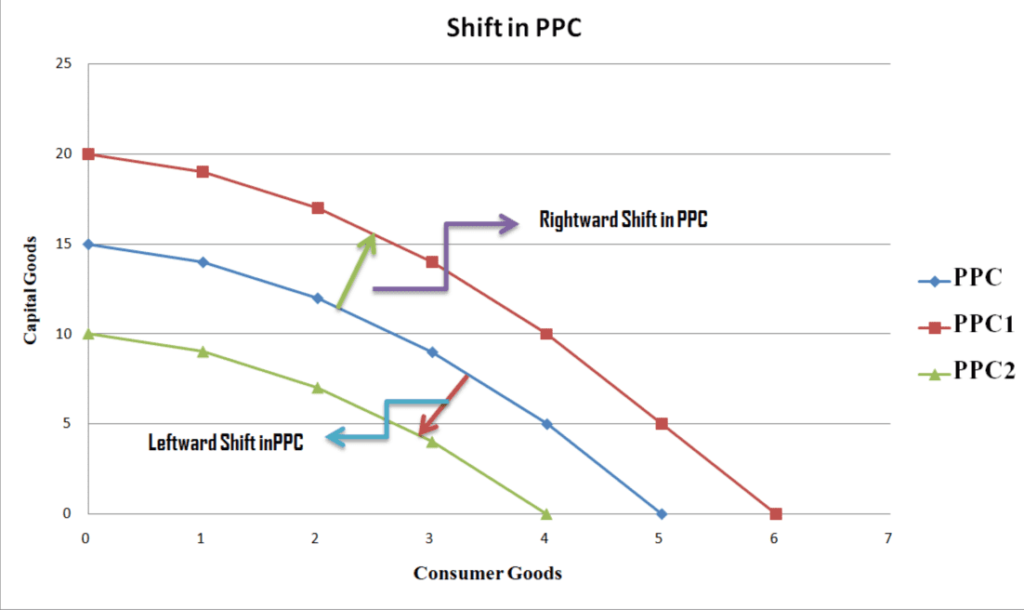
Causes of outward/rightward shift in PPC (From PPC to PPC1)
- Technological progress
- Improvement in productivity of the labor force through training and development
- There may be the availability of new raw materials in large quantity
- New natural materials may also be available for production.
Causes of inward/leftward shift in PPC (From PPC to PPC2)
- Backwardness in technology
- Shortage of natural resources
- Lack of training and skill development programs for the labors
- The decrease in investment in capital, machinery, and pieces of equipment
- Decrease in the size of the population due to war, emigration, etc.
Basic Economic Problems in Production Possibility Curve(PPC)
The fundamental economic problems can be examined with the help of the production possibility curve as below;
The problem of scarcity
The problem of scarcity is reflected in that combination which lies beyond of production possibility curve. For example point G in our PPC. Point G lies outside the PPC and shows that the combination of consumer and capital goods cannot be attained because of the insufficiency of resources to produce them. The economy doesn’t have that many resources to afford the combination G.

The problem of choice
This problem is shown by different alternative points in PPC. The economy has different alternatives to be produced at a given level of resources. Moving one combination to another requires trade-offs. The only possible way of increasing the output of any one commodity is by reducing the resources available for another commodity. This shows the problem of choice in the economy.
The problem of deciding the goods to be produced
The points in the Production Possibility Curve (PPC) represent different quantities of two different goods. Moving from one point to another alters the quantity to be produced from available resources. So there exists the problem of what to produce and PPC shows such problems from its different points. The economy may decide to produce certain quantities of given two goods based on the preferences of the demand in the economy.
The problem of fuller and efficient utilization of resources
The point on the Production Possibility Curve (PPC) shows fuller and more efficient utilization of all the available resources. If the economy produced at any point below the PPC shows the problem of full utilization of resources as well as inefficient utilization of resources. In our PPC point, H shows inefficient and below fuller utilization of available resources.
The problem of economic growth
Economic growth can be defined as the increase in the value and productivity of the economy. This can be shown through the Production Possibility Curve (PPC) by shifting it rightwards. But this is possible only when there is an increase in the availability of resources, on an improvement in the production technology. Due to such the productive capacity of an economy increases and PPC shifts towards the right.
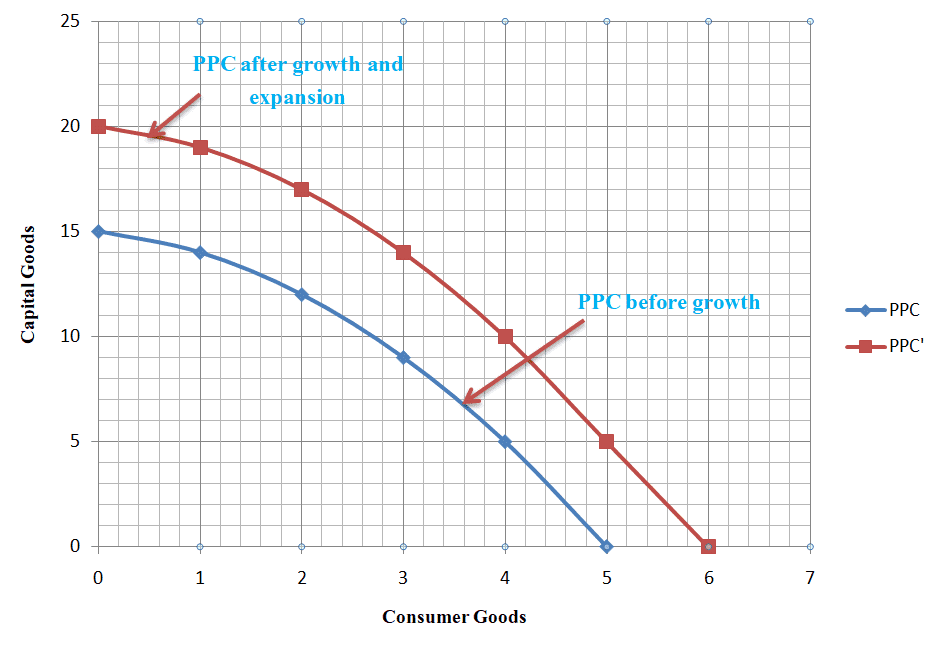
So, the Production Possibility Curve (PPC) is a vital and useful tool in the analysis and explanation of various economic problems that an economy has to face.
The post is very helpful.
Thank You!
So enlightened