Introduction of Engel Curve
The income effect shows the total effect on the demand for goods due to the change in income of the consumer, other things being equal. It is positive in the case of normal goods and negative in the case of inferior goods. The positive income effect refers to the effect of change in the income of consumers on the consumption decision in a positive direction. Likewise, the income effect is negative when the consumer reduces his or her consumption with an increase in his income. In the case of an inferior good, the income effect is negative and in the case of a normal good income, the effect is positive. Here we will explain the derivation of the Engel curve (income effect and derivation of Engel curve).
An Engel curve is developed by German Statistician Ernst Engel (1821-1896) and shows how households’ expenditure on a particular good or service varies with changes in household income. It is the graphical representation of the relationship between the equilibrium quantity purchased of a commodity and the level of consumer income. The Engel curve can be derived with the help of the income consumption curve (ICC). Engel curve is upward sloping (Positive Engel Curve) in the case of a normal good and downward sloping (Negative Engel Curve) in the case of inferior goods.
According to John P. Gould and Edward P. Lazear, ‘An Engel curve is a function relating the equilibrium quantity purchased of a commodity to the level of money income. The name is taken from Christian Lorenz Ernst Engel, a 19th-century German statistician’.
The shape of Engel curves depends on many demographic variables like age and household consumption and other characteristics of consumers. The Engel curve of particular good mirrors the income elasticity of that good and shows the nature of the good (the good is an inferior, normal, or luxury good).
Derivation of Upward Sloping Engel Curve
The Engel curve for a normal good is positive or upward-sloping showing positive income elasticity. The following figure helps to explain it.
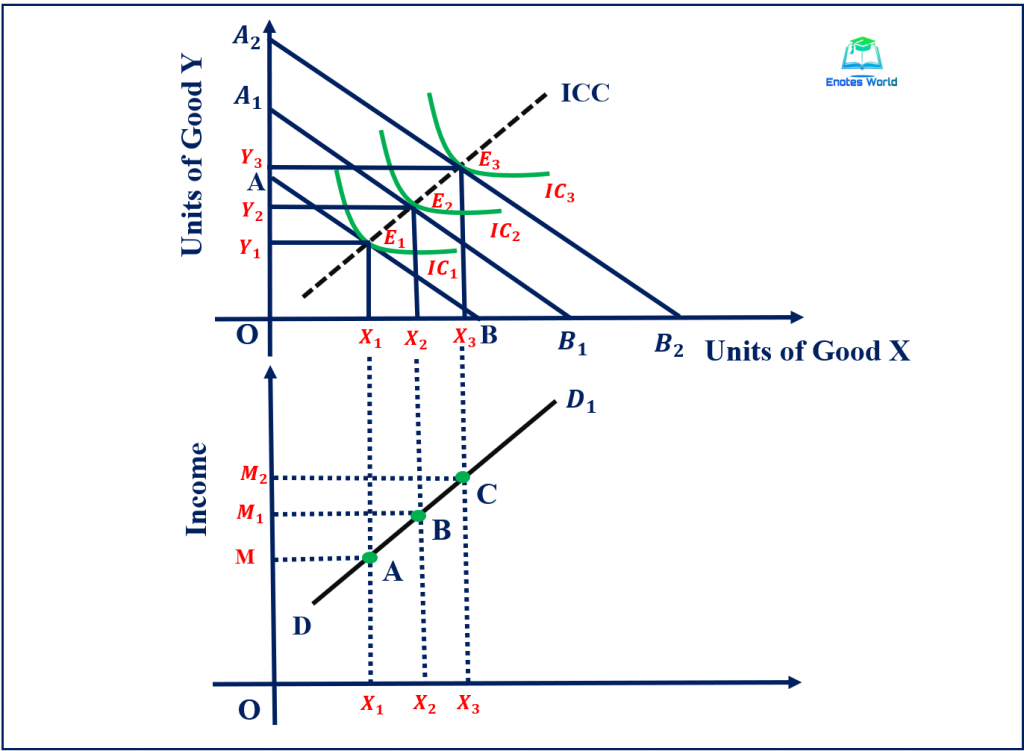
The above figure shows the derivation of the positive Engel curve with the help of the income consumption curve. In the upper portion of the figure, AB is the initial budget line and the consumer is in the equilibrium at point E1 on the indifference curve IC1. At this consumer’s equilibrium point, he has consumed X1 and Y1 units of good X and Y respectively.
Suppose there is an increase in income of the consumer continuously and as a result budget line shifts from AB to A1B1 and from A1B1 to A2B2. With shifted budget lines and higher indifference curves, the consumer’s equilibrium points are also changed from E1 to E2 and from E2 to E3. With the change in equilibrium points, the demand for a good is also changed continually. The quantity demand for goods X and Y has also increased with an increase in income.
If we join all the equilibrium points, we get an upward-sloping income consumption curve (ICC). It slopes upward to the right showing a positive income effect. With the help of such ICC, we can derive an income demand curve or the Engel curve as shown in the lower portion of the diagram.
In the lower portion of the diagram, demand for goods X has measured along the x-axis and the income of the consumer has measured along the y-axis. The demand quantity for good X has been copied from the upper section of the figure as X1, X2, and X2. The increase in money income has shown on the y-axis as M, M1, and M2. These combinations of income and demand for good X are based on equilibrium points derived in the upper part of the figure. Point E1 helps to identify the combination A on the lower segment of the figure. Following the same procedure, we get combinations B and C as well. By joining these points, we get an upward-sloping income demand curve or positive Engel curve.
So, the Engel curve shows the relationship between income and quantity demanded. It shows how the quantity demanded of the commodity changes as the consumer’s income level changes.
Derivation of Downward Sloping Engel Curve
The Engel curve for inferior goods slopes downward. It means if the income effect for a good is negative then the Engel curve slopes downward. The following figure shows the derivation of the Engel curve for the inferior good.

The income effect for a good is believed to be negative when with an increase in his income, the consumer reduces his consumption of the goods. Such goods for which the income effect is negative are known as inferior goods. In the case of an inferior good, the Engel curve is downward sloping.
In the above figure (in Part-A) the consumer is in the equilibrium at point E1 where the budget line AB and indifference curve IC1 are tangent to each other. At this equilibrium point, the consumer buys X1 units of good X and Y1 units of good Y. When there is an increase in income, assuming no change in the price of two goods, the budget line shifts towards the right from AB to A1B1.
The new budget line A1B1 is tangent with the upper indifference curve at point E2. At the new equilibrium point, the consumer buys X2 units of good X and Y2 units of good Y. Here the consumer has increased the demand for good X but reduced the demand for good Y. If there is a further increase in income, the consumer further increases the demand for good X and reduces the demand for good Y. This has been shown by the new equilibrium point on an upper indifference curve IC3.
If we join these three equilibrium points, we get the curve known as the income consumption curve (ICC). The ICC slopes downward to the right showing a negative income effect.
The income demand curve (Engel Curve) for good Y (inferior good) is derived in part C and the Engel demand curve for good X (normal good) is derived in part B of the above figure. Part A of the figure shows a downward-sloping income consumption curve representing good X as a normal good and good Y as an inferior good. At equilibrium point E1, Y1 units of good Y are demanded by the consumer at initial income. It is shown by point A in part C of the figure. Similarly, equilibrium points E2 and E3 show Y2 and Y3 units of good Y are demanded by the consumer with a subsequent increase in income and shown by points B and C in part C of the figure.
If we join points A, B, and C of the diagram in part C, we get a downward-sloping DD1 income demand curve or the Engel curve. The downward slope of the Engel curve shows the inverse relationship between income and demand for inferior goods (demand for good Y).
The Engel Curve and Income Elasticity of Demand
The income demand curve is analogous to the Engel curve as both signify the quantity demanded of a commodity at different levels of consumer income. Therefore, the following relationship between the Engel curve and income elasticity of demand can be observed;
- If a good is normal luxurious, the Engel curve slopes upward to the right, and eY is positive and greater than one.
- If a good is a normal necessity, the Engel curve slopes upwards to the right and eY is positive and less than one.
- If a good is inferior, the Engel curve slopes downwards to the right, and eY is negative.
References and Suggesting Readings
Ahuja, H.L. (2017). Advance Economic Theory. New Delhi: S. Chand & Company.
Dwivedi, D. N. (2018). Microeconomics Theory and Application. New Delhi: Vikas Publishing House PVT LTD
Kanel, N.R. and et. al. (2019). Microeconomics for Business. Kathmandu: Buddha Publications.
Shrestha, R.G. and Adhikari, G.M. (2006). Microeconomics. Kathmandu: Asia Publications Pvt. Ltd.