The income of the consumer is also one of the major factors affecting the consumer’s equilibrium or objective of utility maximization. Consumer’s purchase decision of goods and services changes with the change in his/her income size because the size of income defines the consumer’s ability to pay and purchase. Here we will explain the meaning of the income effect, the effect of change in income on the consumer’s equilibrium, and the derivation income consumption curve (income effect and income consumption curve).
Meaning of Income Effect
Consumer income is one of the major determinants of consumers’ consumption decisions. The income level of the consumer determines their ability to pay. The rate of change in quantity demanded due to a change in the income of a consumer, ceteris paribus is known as Income Effect (IE). Thus, the income effect can be defined as the effect on purchases of the consumer caused by the change in income with prices of goods remaining constant.
When a consumer’s income increases the consumer would move to a higher indifference curve along a new budget line obtaining a higher level of satisfaction at a new equilibrium point. The income effect is different for different goods. It means looking at IE we can identify the nature of goods.
Meaning of Income Consumption Curve (ICC)
If the different equilibrium points of consumers resulting from the change in income are added then we will get a curve called Income Consumption Curve (ICC). Thus, ICC is the locus of consumer equilibrium points at various levels of consumer’s income when the price of goods, consumer’s tastes, preferences, habits, etc. remain constant. ICC shows a set of optimal consumption points formed by a change in income keeping price constant.
Income Effect and Derivation Income Consumption Curve in Different Goods
The effect of change in income on the consumer’s consumption decision is different for different goods and services. Here the income effect in the case of different goods is explained in brief.
Income Effect in the Case of Normal Good
In economics, normal goods are any goods for which demand increases if income increases and falls if income decreases holding price constant. It means there is positive income elasticity of demand in the case of normal goods.
In the case of normal goods, there is a positive income effect. It means the quantity demanded increases with the increase in income and vice versa. The income consumption curve (ICC) is upward-sloping for normal goods. Let’s consider that both goods X and Y are normal goods and see the effect of change in income on the consumption decision with the help of the following diagram.
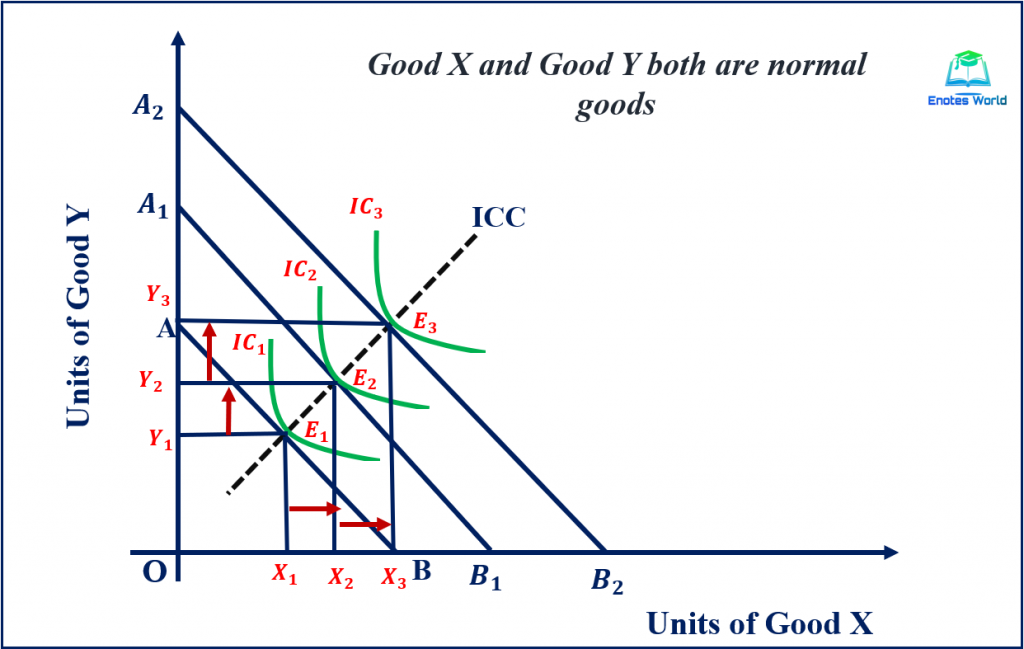
In the above figure, good X is shown along the X-axis, and good Y is shown along the Y-axis. AB is the initial budget line and the consumer is in the equilibrium at point E1 on the indifference curve IC1. At the equilibrium point, the consumer has purchased X1 and Y1 units of goods X and Y respectively.
Suppose that there is an increase in income for the consumer. As a result of the increase in income, the budget line of the consumer shifts outward and becomes A1B1. Now, with the A1B1 budget line consumer is in equilibrium at point E2 on a higher indifference curve IC2. At such an equilibrium, the consumer has increased the quantity demand for goods X and Y. Again, if there is an increase in income the consumer’s budget line further shifts towards the right and the consumer attains equilibrium on higher indifference curve IC3. At equilibrium E3, the consumer has further extended his demand for both of the goods.
If we join all the equilibrium points, we get an upward-sloping curve and which is known as the income consumption curve (ICC). With the increase in income, the consumer has increased his demand for both goods X and Y and as a result, the ICC is upward-sloping. Therefore, if the goods in consideration are normal and there is a change in income the consumption decision will also change positively.
Income Effect in the Case of Inferior Good
In economic theory, an inferior good is a good the demand for which decreases with an increase in consumer’s income assuming the price remains constant. A cheaper car (Nano Car) is an example of an inferior good as consumers will generally prefer cheaper cars when they have limited income. If income increases the demand for Nano cars will decrease and the demand for costly/luxurious cars will increase. The economy class ticket is also considered inferior service (Airlines traditionally have three travel classes, First Class, Business Class, and Economy Class-most expensive, high quality, and basic quality).
In the case of an inferior good, there is a negative effect of income and as a result, the income consumption curve (ICC) will become backward bending or negative in slope. Here we are considering good X as inferior to normal good Y and similarly, good X is a normal good with inferior good Y. The following figures show the income effect in the case of an inferior good.
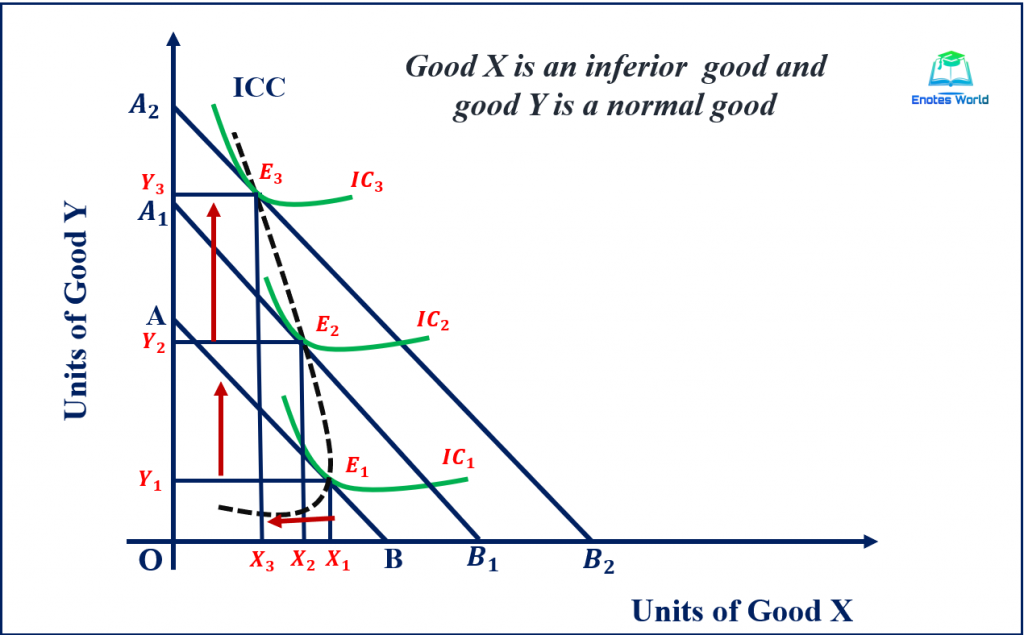
In the first figure, good X is an inferior good, and good Y is a normal good. So, with an increase in income, the consumer buys fewer units of good X and more units of good Y. In this case, we obtain backward to the left income consumption curve or negative sloping ICC.
AB is the initial budget line and the consumer is in the equilibrium at point E1 on the indifference curve IC1. At the equilibrium point, the consumer has purchased X1 and Y1 units of goods X and Y respectively.
When there is an increase in income then the budget line of the consumer shifts outward and becomes A1B1. Now, with the A1B1 budget line consumer is in equilibrium at point E2 on a higher indifference curve IC2. At such an equilibrium, the consumer has increased the quantity demand for good Y and reduced the demand for good X.
Again, if there is an increase in income the consumer’s budget line further shifts towards the right to A2B2 and the consumer attains equilibrium on the higher indifference curve IC3. At equilibrium E3, the consumer has further extended his demand for good Y and reduced the demand for good X.
If we join all the equilibrium points in the first figure, we get a backward-bending income consumption curve (ICC). Thus, in the case of inferior good (if inferior good is measured along the X-axis), the ICC will bend backward or towards the Y-axis.
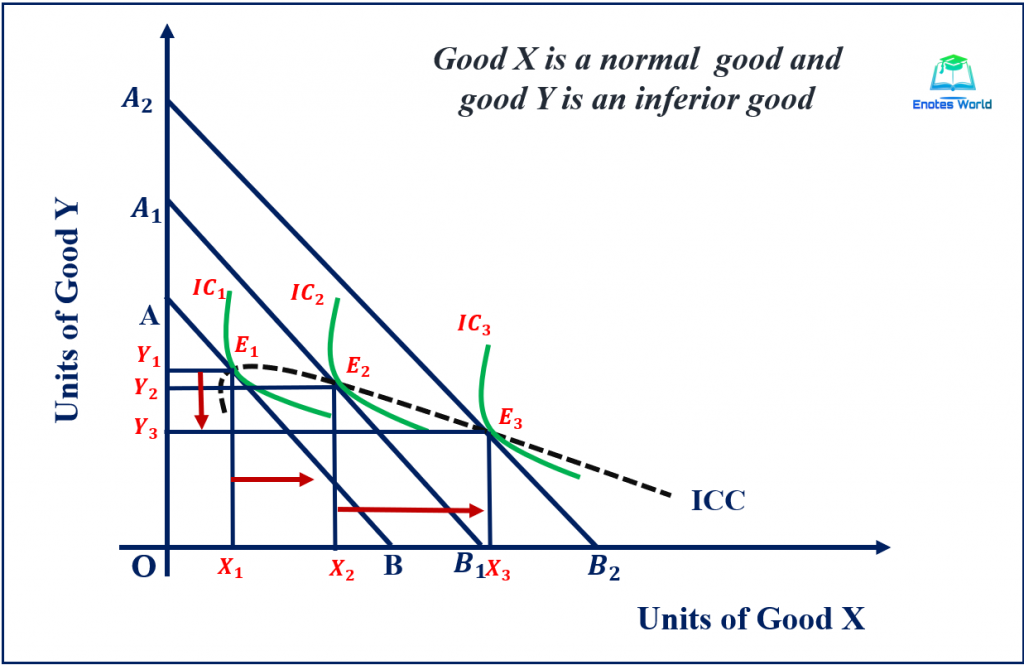
Similarly, in the second figure, we have shown the inferior good on the Y-axis and here we have assumed good Y as an inferior good and good X as a normal good. In this case, there is a continuous increase in the demand for good X and a fall in demand for good Y with the increase in increase. If we add so obtained equilibrium points then we will get the downward bending income consumption curve (ICC), or ICC bends towards the X-axis.
The Case of Neutral Goods
In economics, neutral goods are goods that have a demand that is not dependent on the income level. Treatment medicines, salt, cooking oil, etc. are an example of neutral goods. The demand for neutral goods will not change with a rise/fall in income. Thus, the good is neutral good for which the consumer does not care about consumption at all levels of income. ICC is parallel to Y-axis or vertical if the neutral good is measured along with X-axis and ICC is parallel to X-axis or horizontal if the neutral good is measured along the Y-axis.
The following figures show the income consumption curve (ICC) in the case of neutral goods measured along the X-axis and Y-axis respectively.
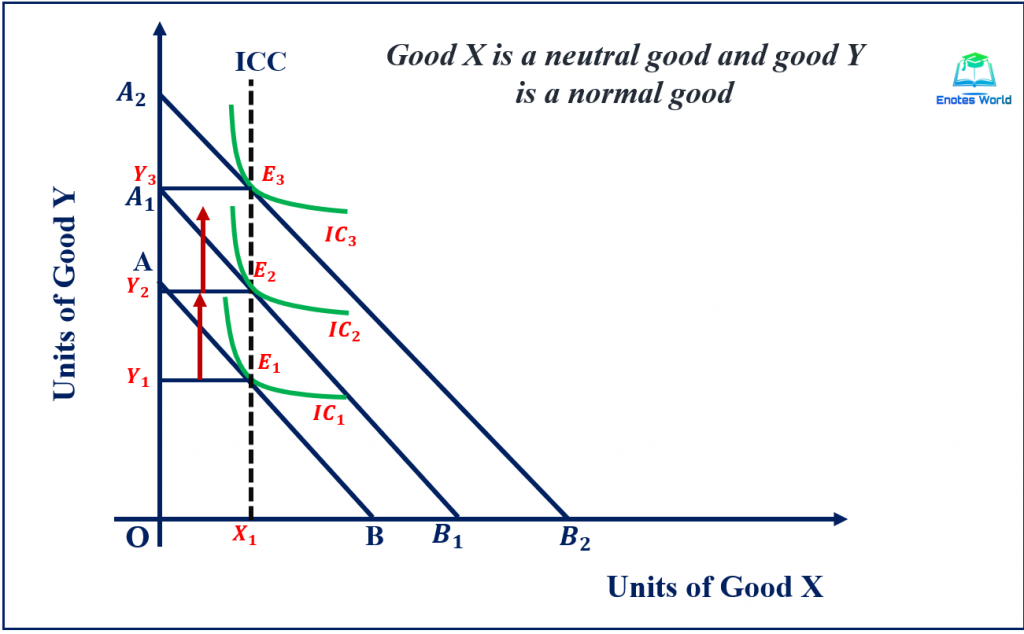
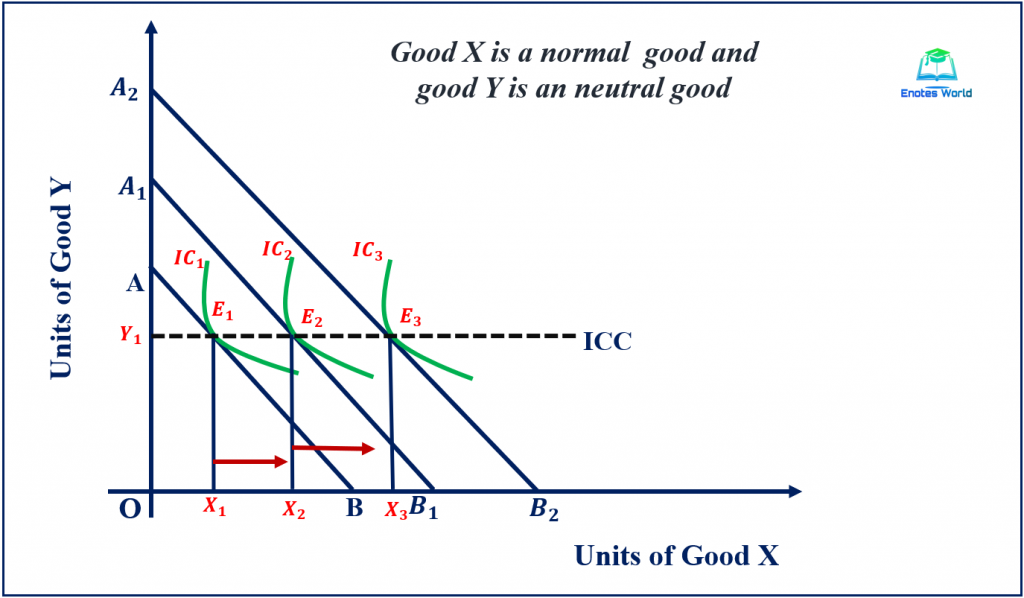
The figure first shows that the neutral good is measured on X-axis or in our case good X is neutral good. AB is the initial budget line and point E1 is the equilibrium of the consumer on the indifference curve IC1. At the equilibrium point, the consumer has purchased X1 and Y1 units of goods X and Y respectively.
When there is an increase in income then the budget line of the consumer shifts outward and becomes A1B1. Now, with the A1B1 budget line consumer is in equilibrium at point E2 on a higher indifference curve IC2. At such an equilibrium condition, the consumer has increased the quantity demand for good Y only as good X is neutral and its demand is not affected by any change in income.
Again, if there is an increase in income the consumer’s budget line further shifts towards the right to A2B2 and the consumer attains equilibrium on the higher indifference curve IC3. At equilibrium E3, the consumer has further extended his demand for good Y only and there is no change in the demand for good X.
If we join all the equilibrium points in the first figure, we get a vertical income consumption curve (ICC). Thus, in the case of neutral good (if neutral good is measured along the X-axis), the ICC will parallel to the Y-axis.
Likewise, in the second figure, we measured the neutral good along the Y-axis and the normal good along the X-axis. It means in our case good Y is now neutral and good X is a normal good. In this case, there is a continuous increase in the demand for good X and the demand for good Y remains the same at every level of income. If we add all the equilibrium points then we get the horizontal income consumption curve (ICC), or ICC will parallel to the X-axis.
Conclusion
The income effect is the change in a consumer’s equilibrium due to a change in income available to the consumer. Thus, it shows the effect on demand for goods and services as a cause of change in the income of the consumer, ceteris paribus. When there is a change in the income of the consumer and the price of the two goods remains the same, the price line will shift. If income rises, the consumer will move to the upper indifference curve and vice-versa.
The income effect is different for different goods as we have discussed above and the shape of the income consumption curve s also changes accordingly. Thus, here we discussed the income effect and income consumption curve in the case of normal, neutral, and inferior goods. The ICC becomes upward-sloping or positively sloping if we have to show the effect of income on the demand for normal goods, it becomes backward bending if we have to show the effect of income on the change in demand for inferior goods and a straight line parallel to either axis if we have to show the effect of change in income on the demand for neutral goods.
Summary Table
The overall process of income effect and the derivation of the income consumption curve discussed above can be presented in the given table.
| Combination | Shape of ICC | Types of IE | Income-Demand relation |
| Normal Goods | Upward Sloping | Positive IE | Positive relation |
| Inferior good and normal good | Backward bending is if the inferior good is measured on X-axis and downward bending is if the inferior good is measured along Y-axis. | Negative IE | Negative relation |
| Neutral good and normal good | Straight-line parallel to the X-axis if the neutral good is measured on Y-axis and a straight line parallels to Y-axis if the neutral good is measured on X-axis. | Zero IE or No IE | No relation |
References and Suggesting Readings
Acharya, K.R. (2018). Microeconomics. Kathmandu: Asmita Books Publishers & Distributors (P) LTD.
Ahuja, H.L. (2017). Advance Economic Theory. New Delhi: S. Chand & Company.
Dhakal, R. (2019). Microeconomics for Business. Kathmandu: Samjahan Publication Pvt. Ltd.
Dwivedi, D. N. (2018). Microeconomics Theory and Application. New Delhi: Vikas Publishing House PVT LTD
Kanel, N.R. and et. al. (2019). Microeconomics for Business. Kathmandu: Buddha Publications.
Shrestha, P.P. and et. al. (2019). Microeconomics for Business. Kathmandu: Advance Saraswati Prakashan.
Thank you so much. It really do work for me!!
Thank you so much. It really do work for me!!
It’s really simple and easy to understand. Keep it up.
Thank you!
It has to be “Increase in income instead of increase in increase”. Find the mistake yourself.
Thank you! it’s done.