In the theory of supply, it is important to distinguish between a movement along the supply curve and a shift in the supply curve (change in quantity supply and change in supply). The concept related to movement along and shift in supply curve can explain below;
Contents
Movement along a Supply Curve/Change in Quantity Supply
When the quantity supply of commodity changes due to change in its price of the commodity, other factors remaining unchanged then it is known as movement along a supply curve or change in quantity supply. Thus, it is a movement between points along a stationary supply curve, ceteris paribus. It also can be defined as the state of increase or decrease in quantity supply of a product due to rise or fall in the price of the product, all other non-price determinants of supply like the price of inputs, technology, the policy of the government, etc. remaining same. The change in quantity supply may be of two types.
- Expansion in Supply
- Contraction in Supply
Expansion in Supply
The increase in quantity supply due to an increase in the price of the product is the expansion of supply. It means when the quantity supply of a commodity rises with a rise in its price, other factors affecting supply remaining the same, then it is the expansion of supply or expansion in supply. It represents an increase in quantity supply in the market.
Contraction in Supply
The decrease in quantity supply as a result of a fall in the price of the product is the contraction of supply. It means when the quantity supply of a commodity falls with a fall in its price, other factors affecting quantity supply remaining the same, then it is a contraction of supply. It represents a decrease in the quantity supply of a commodity in the market.
The table below will help us to get the concept of expansion and contraction of supply or movement along a supply curve.
| Price (in Rs.) | Supply (in kg) |
| 20 | 200 |
| 35(Rise) | 300 (Extension in Supply) |
| 10 (Fall) | 100 (Contraction in Supply) |
In the above table when the price of goods increases from Rs. 20 to Rs. 35, a producer’s supply also rises from 200 units to 300 units. This is the expansion or extension of supply. Similarly, with a decrease in price from Rs. 20 to Rs. 10, the supplier’s supply also falls from 200 units to 100 units. This is called contraction of supply.
Any point on a supply curve represents a particular quantity being supplied at a certain price. Different points on a stationary supply curve represent different supply quantities at different prices. Therefore, a change in quantity supply is represented by a movement along a particular supply curve. A movement down a supply curve is called a fall in the quantity supplied or contraction of supply. On the other hand, an upward movement of the supply curve is known as a rise in quantity supplied or extension or expansion of supply.
Thus, a change in the quantity supplied as a result of a change in the price of a commodity alone is not able to draw a new supply curve, but it is being represented by the movement up or down on a given constant supply curve. This concept can be further explained with the help of the diagram given below;
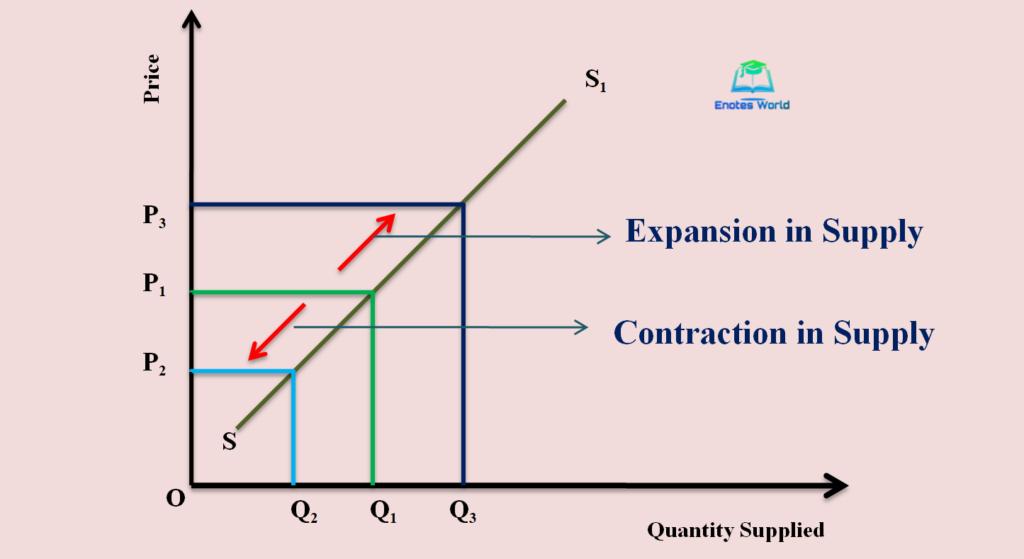
In the above figure, SS1 is an upward sloping supply curve representing various combinations of price and supply. Suppose the initial price is P1 with the corresponding supply of Q1. The point e1 represents such a combination. When there is an increase in price from P1 to P3, the new combination has formed by point e3.
Thus the movement from point e1 to e2 is expansion or extension of supply or rise in quantity supplied. Similarly, when there is a fall in price from P1 to P2 the corresponding supply also decreases as represented by combination e2. The movement from point e1 to e2 is the contraction of supply or fall in quantity supplied. Therefore the change in price-supply combination from e1 to e2 and e3 is the movement along the supply curve or change in quantity supply. And it is due to the change in the own price of the commodity.
The Shift in Supply Curve or Change in Supply
The amount of supply may not change only because of the price of the commodity but also due to the change in factors other than the price of the commodity. When there is a change in supply due to a change in factors affecting supply other than the own price of the commodity is studied under a shift in supply. It means when there is an increase or decrease in the supplied amount as a result of the change in non-price determinants of supply; it is a shift in supply or change in supply. The shift indicates that there is a larger or smaller amount of supply at a similar price and that is determined by the nature of the effect of other factors affecting supply.
A change in supply is involved when the entire supply curve shifts. An increase or decrease in supply due to change in determinates except the price is represented by shit in the supply curve. It may be of two types;
- Increase in supply or Rightward/Outward Shift
- The decrease in supply or Leftward/Inward Shift
Increase in Supply
It refers to a case in which the producer prefers to sell a larger quantity of a commodity at the same price due to favorable changes in factors other than the own price of the commodity. An increase in supply may take place due to a decrease in the cost of production, improvement in techniques of production, a fall in the price of related goods, lowering taxes and increasing the subsidies by the government, etc. It is also called a rightward or outward shift in the supply curve.
Decrease in Supply
It refers to a situation in which the suppliers sell less quantity of the commodity at the same price. The decrease in supply takes place due to an unfavorable change in factors affecting supply other than the price of the commodity. It is due to an increase in input prices, an increase in the price of related goods, an increase in taxation by the government, and so on. This concept is also called a leftward or inward shift in the supply curve.
The concept of a rightward and leftward shift in supply can explain with the help of following table and diagram;
| Price (in Rs.) | Initial Supply at Cost=Rs 100 | Supply at Cost = Rs. 75 | Supply at Cost= Rs. 200 |
| 10 | 100 | 200 | 50 |
| 20 | 200 | 400 | 100 |
| 30 | 300 | 600 | 150 |
In the given table the supply schedule at a different level cost of production is given. The second column shows the initial supply schedule that shows various quantities of supply at different prices when the cost of production is Rs. 100. Now suppose the cost of production increases to Rs.200. The corresponding supply at various same prices shows in the fourth column. From this, we realize that the quantity supply decreases with an increase in the cost of production assuming the price remains the same. This is a decrease in supply or a leftward shift in supply.
Again when there is a decrease in the cost of production to Rs.75. The corresponding supply at the same prices shows in the third column. From this, we realize that the quantity supply increases with a decrease in the cost of production assuming the price remains the same. This is known as an increase in supply or a rightward shift in supply. The following diagram helps to explain the concept of the shift in the supply curve.

A change in one or more determinants of supply except for price, such as cost of factors, price of related goods, governmental policy, etc. will cause a change in supply. An increase in supply shifts the entire supply curve to the right, from S to S2.
The rightward shifts in the supply curve represent that suppliers are ready to sell large quantities at constant prices due to changes in other determinants of demand (decrease in the cost of production). A decrease in supply shifts the supply curve to the left from S to S1. This leftward shift in the supply curve indicates that sellers are willing to sell less quantity at a constant price due to changes in other determinants of demand (increase in the cost of production).
Thus, an increase in supply means that the entire supply curve shifts to the right, demonstrating a larger amount of supply at every price.
The decrease in supply means that the entire supply curve shifts to the left, signifying a fewer amount of supply at every price.
Causes of Shift/Change in Supply/Shifting Factors
Change or shift in supply may be an increase in demand or decrease in supply based on the nature of the effect of change in determinants of supply other than the price of the product. If there is a favorable or positive effect of change in determinants other than price then the supply curve will shift towards right from its original position (increase in supply). And if there is an unfavorable or negative effect of change in determinants of supply other than price then the entire supply curve will shift to the left from its original position (decrease in supply).
Thus the cause of shift includes various non-price determinants of supply that cause shift/change in the supply of the product. The following table shows the major shifting factors or causes of shift/change in the supply curve.
| Cause/Shift Factor | Increase in Supply/Rightward Shift | The decrease in Supply/Leftward Shift |
| Technology | Improvement in production techniques | Use of less efficient technology |
| Price of Other Goods | The decrease in the price of other goods | The increase in the price of other goods |
| Price of Inputs | Fall in the price of inputs or factors of production | The rise in the price of inputs |
| Tax and Subsidies | The decrease in taxation and an increase in production subsidies | An increase in taxation and a decrease in production subsidies |
| Price Expectations of Producers | The expectation of a fall in price soon | The expectation of a rise in price soon |
| Number of Firms | Increase in the number of sellers | The decrease in the number of sellers. |
Expansion of Supply versus Increase in Supply
The major differences between upward movement or expansion of demand and rightward shift or increase in supply are following;
| Expansion of Supply | Increase in Supply |
| It refers to the larger quantity being supplied by the seller due to a rise in the price of a commodity. | It refers to more amount of supply at the same price. |
| The expansion of demand is due to a rise in the price of the goods. | An increase in supply is due to change or favorable change of other factors affecting supply except for the price. |
| It is related to movement along a supply curve. So it is shown by upward movement along the supply curve. | It is related to a shift in the supply curve. So it is represented by the outward shift in the supply curve. |
| It follows the law of supply | It does not follow the law of supply. |
Contraction of Supply versus Decrease in Supply
The major differences between upward movement/contraction of supply and leftward shirt or decrease in supply are following;
| Contraction of Demand | Decrease in Demand |
| Falls in the quantity supply due to a fall in the own price of the product. | A smaller amount of supply at the same price. |
| It is due to a decrease in the own price of the product. | It is due to the unfavourable or negative effect of determinants of supply other than price |
| It is shown by downward movement along the same supply curve. | It is exposed by a leftward shift in the supply curve. |
| It operates according to the law of supply. | It does not follow the law of supply. |
References and Suggested Readings
Adhikari, G.M. (2012). Microeconomics. Kathmandu: Asmita Publication
Dwibedi, D.N. (2003). Microeconomics Theory and Applications. Delhi: Vikas Publishing House Pvt. Ltd.
Kanel, N.R. and et.al. (2016). Microeconomics. Kathmandu: Buddha Publication.
Mankiw, N.G. (2009). Principles of Microeconomics. New Delhi: Centage Learning India Private Limited